Road Safety Assessment: Automating Road Risk Scoring with Computer Vision and Machine Learning
10 min readUpdated October 19, 2026
Omdena
iRAP maintains the world’s largest road safety database — more than 1 million kilometres across 100+ countries — yet every attribute update requires human coders to review road imagery section by section, at a pace that cannot keep up with changing road conditions. Omdena partnered with iRAP to replace that bottleneck with an AI pipeline built on computer vision and machine learning. The 8-week build delivered object detection models, a feature importance framework for 66 road attributes, an automated scoring pipeline, and an interactive safety dashboard, all open source.
Key Outcomes
Outcome
Detail
Road data
1 million+ km of road data from iRAP’s global database
Road attributes analyzed
66 iRAP attributes ranked across 4 road user types: cars, motorcycles, pedestrians, cyclists
5 combined: Chi-squared, Mutual Information Score, Random Forest, XGBoost, Catboost
Pipeline automation
Prefect DAG workflows + Papermill parameterized notebook execution
Deployment
Interactive dashboard delivering iRAP Risk Maps and Star Rating predictions
Potential impact
Estimated 450,000 lives saved annually and 100 million+ injuries prevented; new roads targeted at 3-star minimum
The Problem: Manual Road Attribute Coding Cannot Scale to 1 Million Kilometres of Global Road Infrastructure
Road crashes are the leading cause of death for people aged 5 to 29 worldwide, injuring more than 100,000 every day. iRAP assesses crash risk using 66 attributes coded per 100-metre road section: traffic flow, lane count, intersection type, speed limits, lighting, road curvature, and safety barriers. Across more than 1 million kilometres in their database, this coding is performed largely by hand.
Road attributes change as infrastructure is built, repaired, or degraded. A manual process cannot keep pace, meaning star ratings lag behind reality and investment decisions rely on outdated data. The project asked whether AI could make attribute coding faster, more consistent, and less dependent on field work.
The Partnership: Omdena and the International Road Assessment Programme
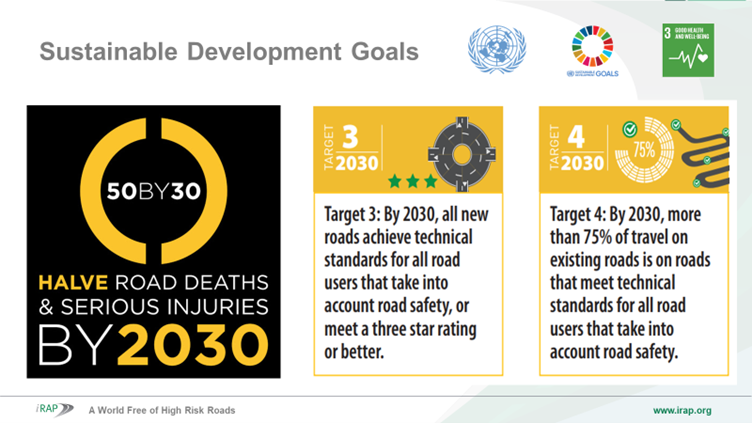
iRAP is a charitable organization dedicated to eliminating high-risk roads globally. Its 5-star rating system, applied separately for cars, motorcycles, pedestrians, and cyclists, provides a standardized crash risk measure across more than 100 countries and supports the UN Sustainable Development Goal of halving road deaths and injuries by 2030.
iRAP’s road safety targets under the UN SDGs: halving road deaths and injuries by 2030, with all new roads achieving a minimum 3-star rating. Source: iRAP
Omdena partnered with iRAP for an 8-week AI challenge to automate the most time-intensive parts of the assessment workflow. The Omdena team brought expertise in computer vision, geospatial analysis, and statistical modeling to the project.
Why Road Safety Assessment at Scale Is Hard
Sixty-six attributes must be coded per 100-metre road section across four road user types: iRAP’s rating system requires attribute collection covering traffic flow, road geometry, speed limits, lighting, and safety features. Automating this at scale requires multiple computer vision and data extraction approaches working in parallel, each targeting a different attribute class.
Ground-level and aerial imagery require entirely different model architectures: Detecting road objects at street level from panoramic images demands different techniques than classifying intersection types from satellite data. No single pre-trained model handles both, and panoramic imagery required a dedicated annotation sprint before training could begin.
Historical crash datasets are large but geographically uneven: The UK Department for Transport datasets used for risk score modeling contained millions of records, but features and formats available for one country do not transfer directly to global road networks without significant adaptation work.
Building the Road Safety AI System: Computer Vision, Feature Analysis, and Automated Risk Scoring
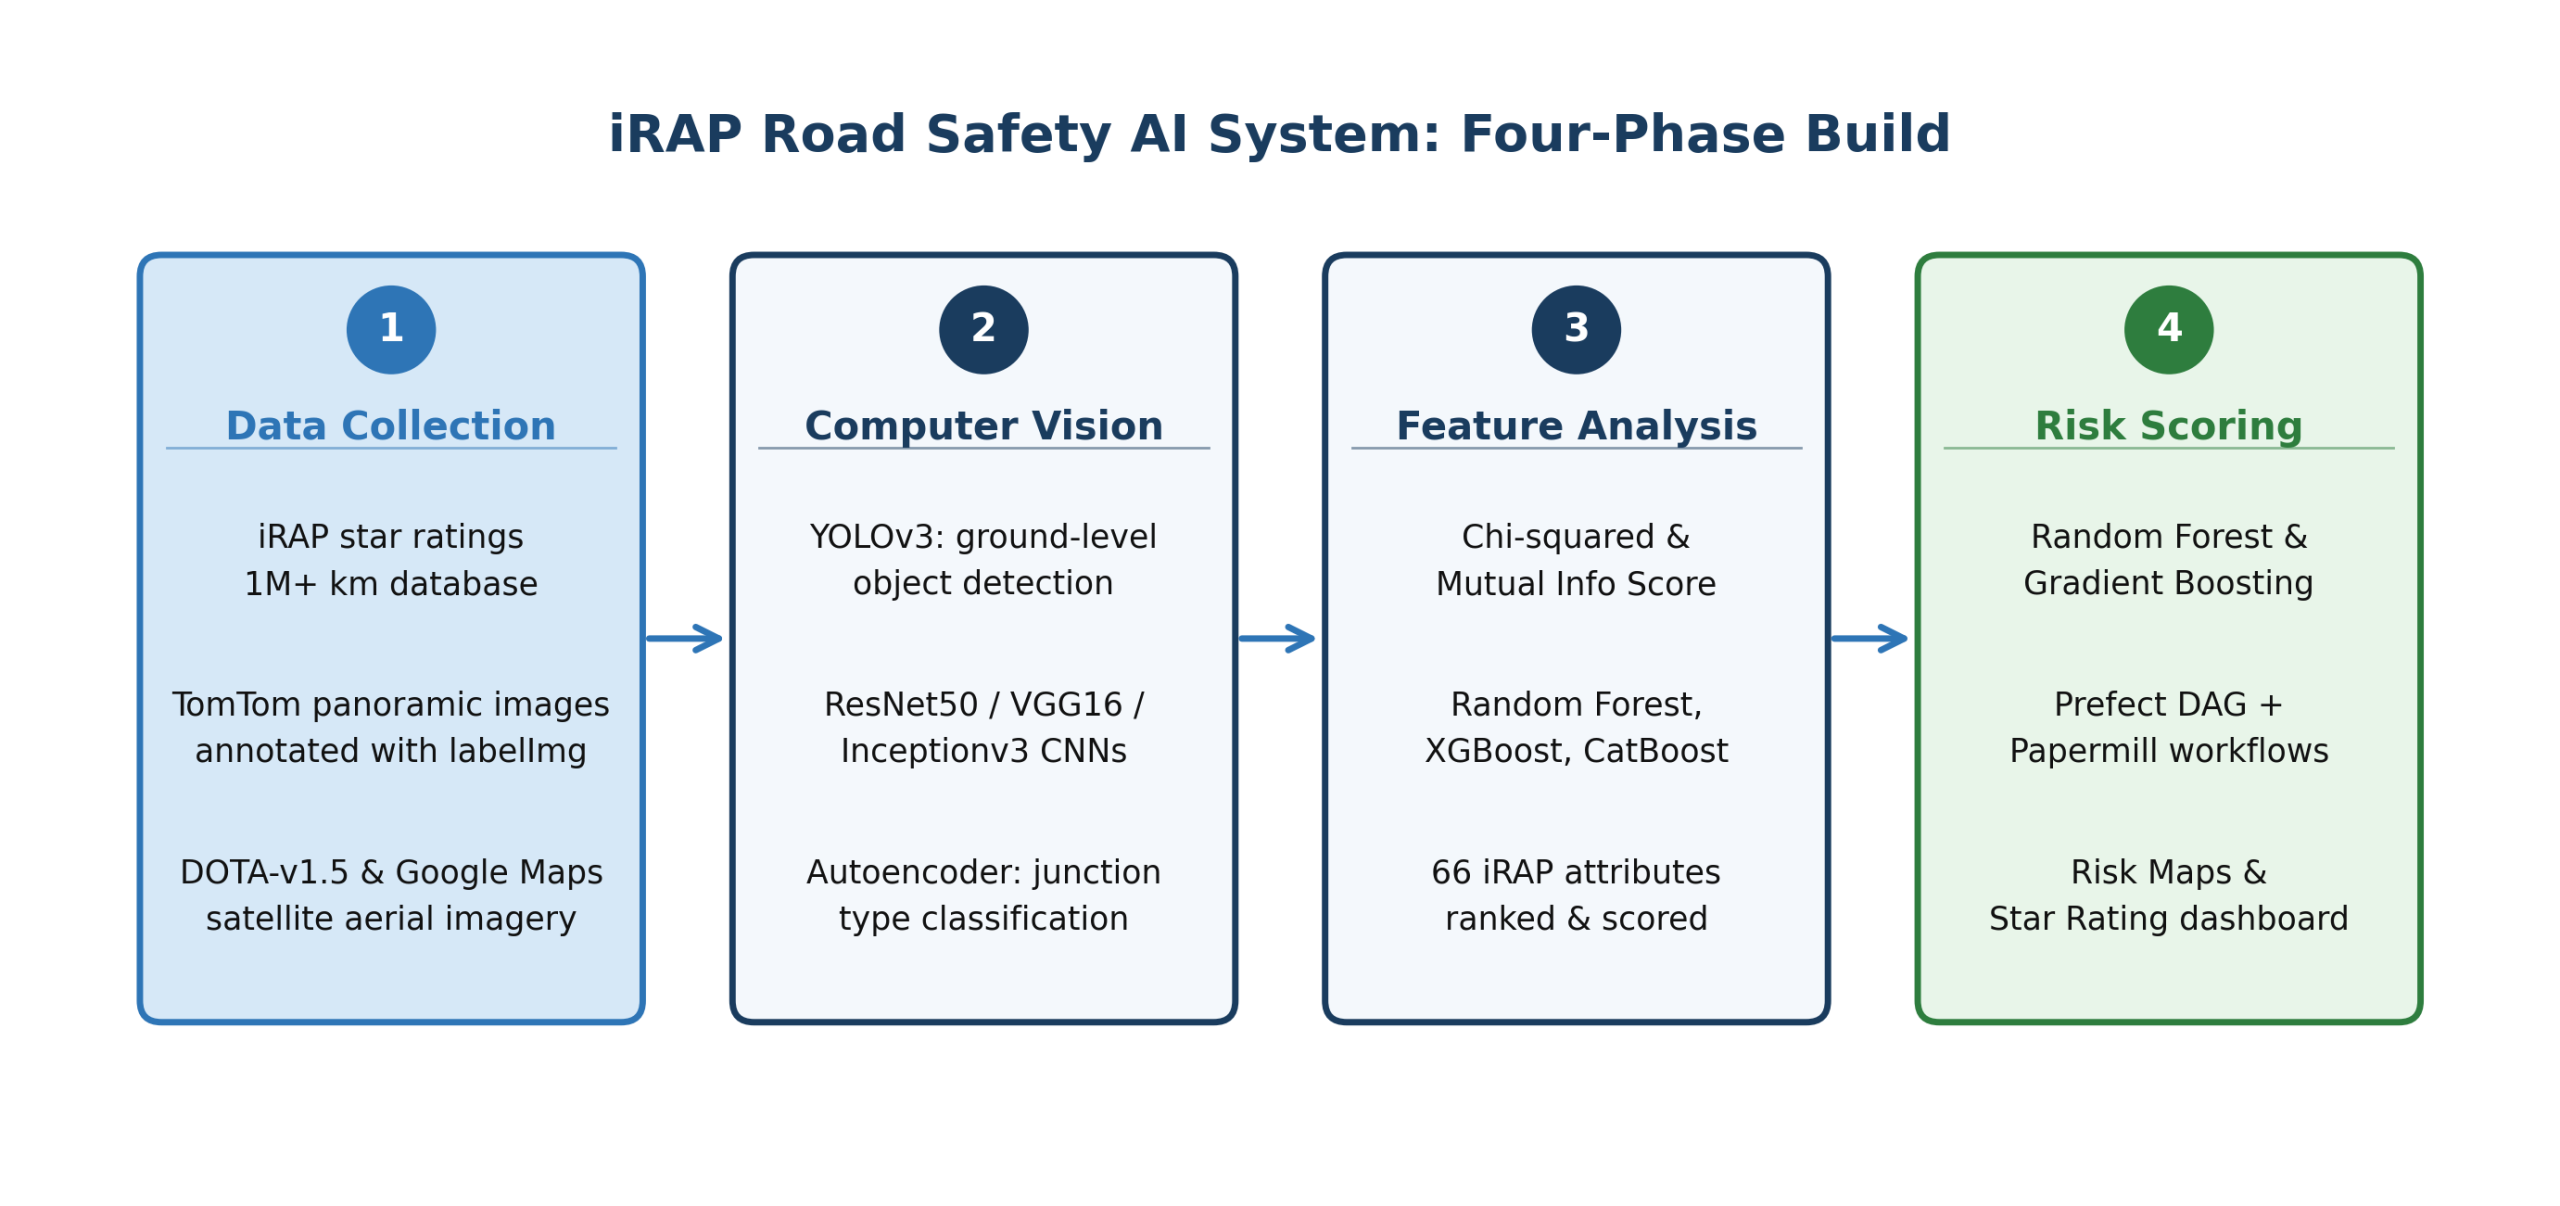
Four-phase AI build: data collection and annotation, computer vision for ground-level and aerial imagery, feature importance analysis across 66 road attributes, and risk scoring with automated pipeline delivery. Source: Omdena
Phase 1: Data Collection and Annotation
iRAP’s database provided star ratings for over 1 million kilometres of roads. Ground-level imagery came from TomTom panoramic datasets; aerial imagery from DOTA-v1.5 and Google Maps satellite data. UK Department for Transport road safety data provided historical crash records, supplemented by OpenStreetMap proximity features via the osmnx Python package.
Phase 2: Object Detection and Computer Vision
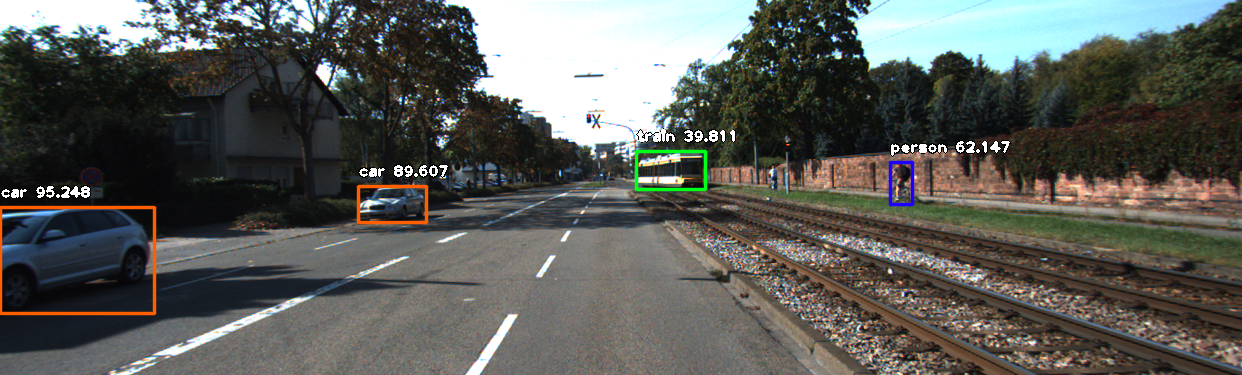
For ground-level imagery, YOLOv3 was selected over Histogram of Oriented Gradients (HOG), MobileNet SSD, and RetinaNet. Panoramic TomTom images required a dedicated annotation sprint before any training could begin, as no existing labeled dataset covered the wide-angle road imagery format used.
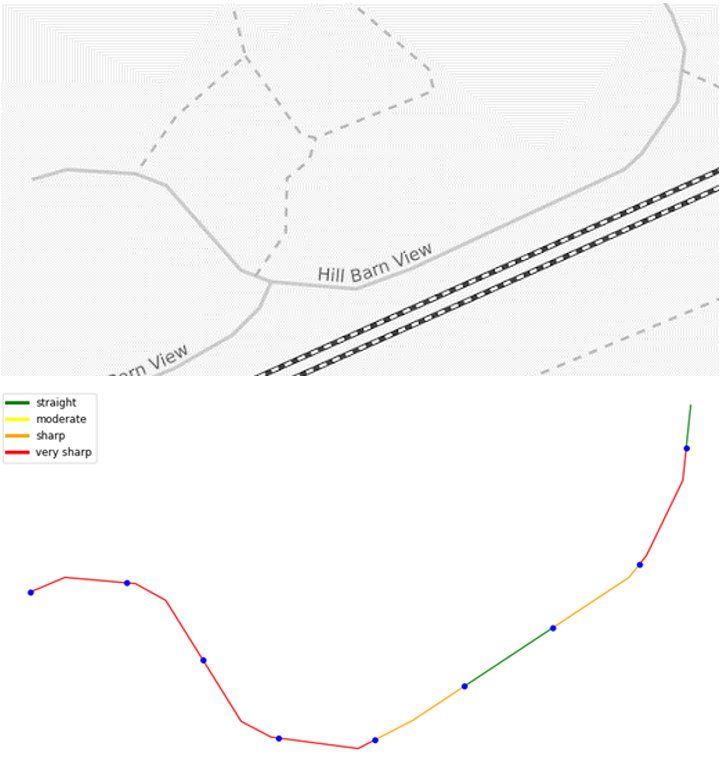
For aerial imagery, ResNet50, VGG16, and Inceptionv3 were evaluated on the DOTA-v1.5 dataset. A ResNet50 model detected school road warning signs, an autoencoder classified intersection types, and road curvature was estimated from OpenStreetMap geometry.
Phase 3: Feature Importance Analysis Across 66 Road Attributes
To determine which of iRAP’s 66 attributes most influence star ratings, the team applied five methods: Chi-squared analysis, Mutual Information Score, Random Forest, XGBoost, and Catboost regressors. Each was run separately for four road user types, and the results were merged using a points system to produce a stable overall feature importance ranking.
Phase 4: Risk Score Estimation and Pipeline Automation
Road risk scores were modeled using UK Department for Transport road safety and traffic datasets, augmented with OpenStreetMap proximity features for schools, hospitals, and public venues. Random Forest and Gradient Boosting regressors were trained with accident severity as the target variable.
An automated pipeline was built using Prefect for DAG-based workflow management and Papermill for parameterized notebook execution, enabling continuous data gathering, road segmentation, curvature rating, and iRAP score prediction. Designing for ongoing operation from the start avoided the common pattern of retrofitting automation onto a workflow built for one-time use.
What Was Delivered: A Road Safety Dashboard and Automated Assessment Pipeline
The 8-week build produced a unified platform integrating all four phases: an interactive dashboard for road safety visualization, an automated pipeline for continuous attribute extraction and scoring, and models for object detection, feature analysis, and risk estimation.
iRAP Risk Maps and Star Rating dashboard: An interactive dashboard delivering risk maps and 5-star rating predictions for cars, motorcycles, pedestrians, and cyclists, allowing road safety stakeholders to identify dangerous road segments and prioritize infrastructure investment without manual attribute coding.
Feature importance framework for 66 road attributes: A combined statistical and ML ranking of iRAP’s full attribute set, giving assessment teams a principled basis for focusing data collection on the attributes with the greatest predictive impact on safety ratings across all four road user types.
Automated data-to-rating pipeline: A Prefect-based DAG workflow integrating data collection, road segmentation, attribute extraction, and star rating prediction. The pipeline ingests road imagery and outputs updated iRAP attribute scores automatically, designed for continuous re-assessment as road conditions and infrastructure change over time.
Impact: What iRAP Could Do That They Could Not Before
Before this project, generating road safety scores required manual attribute coding at every step. The automated pipeline demonstrated that ground-level and aerial imagery could be processed to update attribute data and star ratings without field teams coding each section individually, making automated continuous assessment achievable at iRAP’s scale.
Road safety stakeholders across more than 100 countries gained access to a dashboard that converts raw imagery and attribute data into actionable star ratings and risk maps. Infrastructure planners could identify high-risk road segments and model the expected return on safety investment — estimated at $8 per $1 invested — before committing funds.
iRAP risk map output: road segments colored by crash risk score, giving planners a visual index of where safety investment is most needed. Source: Omdena
The feature importance analysis answered a question previously approached intuitively: which of the 66 attributes drive star ratings most for each road user type. That ranking allows data collection to concentrate on the highest-value attributes, reducing the effort required per assessment cycle.
Benefits for Clients: Automation, Evidence, and an Open Codebase
Automated road attribute extraction at scale: The computer vision pipeline replaces manual coding for key road features, enabling assessments to be updated as imagery is refreshed rather than requiring field visits per segment. iRAP’s 1 million+ km dataset becomes a continuously updatable resource rather than a static snapshot.
No specialist field coding expertise required to update ratings: The dashboard accepts standard road imagery and dataset inputs and produces star rating predictions automatically. Road safety agencies without large field assessment teams can generate actionable safety scores from existing data sources.
Open-source via OmdenaLore: All models, pipelines, and feature analysis frameworks are available through OmdenaLore, Omdena’s open-source knowledge-sharing platform. Any government road authority or road safety organization can audit, adapt, and deploy the system for their own national road assessment program at no cost.
What Building a Road Safety AI System for iRAP Taught Us
Panoramic imagery requires dedicated labeling before any model can be trained — off-the-shelf detectors do not transfer directly
Pre-trained models for standard photographs do not transfer to panoramic road imagery. The team ran a dedicated annotation sprint on TomTom data before any detection training could begin. Road-specific panoramic data requires purpose-built labeling, not direct transfer from standard benchmarks.
Combining five feature analysis methods produced more stable rankings than any single method could deliver
Any single method for feature ranking reflects its own assumptions. Chi-squared and Mutual Information Score capture different relationships than tree-based models do. Combining all five into a points-based consensus ranking produced a more defensible ordering of iRAP’s 66 attributes than any individual method delivered alone.
An automated pipeline built for continuous re-assessment is more valuable than a one-time model — road conditions change
iRAP’s star ratings are only as current as the data behind them. Building the pipeline on Prefect and Papermill from the start (rather than retrofitting automation later) made continuous re-assessment a design property of the system, not a post-launch addition. Road safety agencies need assessments that update as conditions change.
What’s Next: Extending the System to International Road Networks
Expanding to low- and middle-income country road networks: The pipeline was demonstrated on UK and selected international datasets. Extending it to low- and middle-income country road networks, where crash rates are highest and manual assessment capacity is most limited, would materially scale the program’s global reach.
Retraining risk models on international crash datasets: The risk scoring models were trained on UK Department for Transport crash and traffic data. Extending predictive accuracy to other countries requires equivalent datasets from target geographies. Partnerships with national road authorities in high-burden regions could provide the training data needed for global deployment.
Key Achievements
A Multi-Source Computer Vision Pipeline for Automated Road Feature Extraction
The project delivered a computer vision pipeline combining YOLOv3 for ground-level object detection, ResNet50 and Inceptionv3 for aerial traffic analysis, and specialized models for intersection and curvature classification. Together, these systems demonstrated automated extraction of road attributes that previously required manual field coding at every 100-metre section.
A Consensus Feature Importance Framework Across All Four iRAP Road User Types
By combining two statistical methods and three regression models across four road user types, the team produced a stable ranking of iRAP’s 66 attributes by predictive impact. The framework helps assessment teams focus data collection on features with the strongest influence on safety scores.
An Open, Continuously Updatable Road Assessment Pipeline
The Prefect and Papermill-based automation framework transformed the assessment workflow from a static, manually coded exercise into a repeatable, parameterized pipeline. Published as open source through OmdenaLore, it gives any road safety organization a foundation for continuous road attribute assessment without rebuilding from scratch.
About the Project
Omdena partnered with iRAP to build an AI-powered road safety assessment system. In just 8 weeks, the Omdena team developed computer vision models, a feature-importance framework covering 66 road attributes, an automated risk-scoring pipeline, and an interactive safety dashboard.
FAQ
What is the iRAP star rating system and what does AI add to it?
iRAP rates roads from 1 to 5 stars across four road user types based on 66+ coded attributes. The AI system automates attribute extraction from imagery and predicts star ratings without manual coding, making assessments scalable to networks that cannot be assessed by hand.
Which road attributes most influence the star rating?
The feature importance analysis ranked all 66 iRAP attributes using five combined methods. Results varied by road user type: the most impactful features for car ratings differ from those for pedestrians or cyclists. The full ranked lists are available in the project documentation for each user category.
What computer vision models were used and why was YOLOv3 selected?
For ground-level imagery, YOLOv3, HOG, MobileNet SSD, and RetinaNet were evaluated. YOLOv3 was selected for its flexibility and adequate performance across the road object detection tasks required. For aerial imagery, ResNet50, VGG16, and Inceptionv3 were evaluated on the DOTA-v1.5 dataset.
Can this system be applied to road networks outside the UK?
The pipeline was designed for global application. Risk scoring models were trained on UK data, so adaptation and retraining are required for other geographies. Computer vision and feature extraction models transfer more directly, as they do not depend on country-specific crash records.
Is the system in active use by iRAP?
The project delivered a proof-of-concept demonstrating automated feature extraction, risk scoring, and dashboard visualization. Integration into iRAP's operational workflow depends on further validation, expanded training data for international road networks, and institutional adoption decisions by iRAP.
Share this article
Share on LinkedIn, send by email, or copy the direct link.