Infrastructure Gap Mapping Across 54 African Countries: NLP and Remote Sensing for Government Planning
12 min readUpdated September 24, 2026
Omdena
African governments are investing public budgets in infrastructure for current conditions, while climate change, urbanization, and migration are reshaping where populations will live and what infrastructure they will need over the next 50 years. Omdena partnered with the African Center for Economic Transformation (ACET) to build an AI system combining Twitter NLP, population and electricity modeling, hydrological drought prediction, and spatial gap analysis. Fifty collaborators delivered an interactive Streamlit dashboard consolidating all five analytical streams, a planning intelligence tool designed for African government policymakers and infrastructure planners.
Watch the Webinar
See how AI can help planners identify infrastructure gaps and prepare for future needs.
In this webinar, we explore the approach, data, and AI technologies behind the project, along with key findings and practical applications for infrastructure planning and future-needs identification.
KEY OUTCOMES
Team
50 global collaborators
NLP analysis
14 infrastructure topics across a 10-year Twitter dataset for Kenya and Nigeria
Population modeling
District-level population density mapped for East, North, and West Africa
Electricity modeling
Access gap analysis and projections for 5 countries: Burundi, Ghana, Nigeria, Benin, Cameroon
Drought prediction
Water stress index forecasts for high-drought-risk African countries using GRACE satellite data
Spatial scoring
Infrastructure access deficit scores for all administrative units in Burundi across 4 SDG domains
Deliverable
Interactive Streamlit dashboard consolidating five analytical streams
Partners
African Center for Economic Transformation (ACET), Omdena
The Problem: Infrastructure Planning for the Past in a Continent Changing Fast
African governments devote significant portions of public budgets to roads, schools, hospitals, and power grids designed around current population distributions and service demands. The problem is that Africa is changing at a pace that infrastructure planning cycles do not reflect: urban populations are expanding rapidly, climate patterns are shifting, and migration is redistributing where people live and work.
Infrastructure built today has a working life of 50 to 100 years. A hospital built in a rural district today will still be serving — or failing to serve — that district in 2075. If the district’s population has shifted, its water sources have diminished, or economic activity has moved elsewhere, the investment may be misallocated from the day it opens.
ACET identified this forward-looking planning gap as a priority challenge. African governments need evidence of where populations will live, where water stress will intensify, where economic activity will cluster, and where access to roads and services will be most scarce, not as a picture of the present, but as a projection of the future.
The Partnership: Omdena and ACET
ACET is a pan-African institution that works with governments across the continent to achieve sustained economic transformation. It identified infrastructure planning (specifically, the gap between investments based on current conditions and those guided by future projections) as a challenge where data science could make a material contribution to policy decisions.
Omdena contributed its collaborative challenge model: a structured AI development process that brings together practitioners from around the world to work on a shared problem within a defined time frame. Fifty collaborators worked across data collection, NLP modeling, geospatial analysis, and dashboard development, spanning the full technical breadth the project required.
Why Predicting Africa’s Infrastructure Needs Is Hard: Scale, Fragmentation, and Uncertainty
No single data source captures Africa’s infrastructure picture. Government records are incomplete and inconsistently maintained across the continent. Satellite imagery shows land use and physical assets but not human aspiration or economic trajectory. Population projections at national level mask the regional variation that determines where specific investments are needed. Combining these sources into a coherent planning picture requires working across formats, institutions, and languages.
Scale adds further difficulty. Africa comprises 54 countries with distinct languages, governance structures, building traditions, and climate conditions. A modeling approach calibrated for Nigeria (with its dense urban centers, specific climate zones, and large informal economy) does not transfer directly to Burundi or Benin. Predicting 50-year infrastructure needs compounds the challenge: no model can anticipate political disruptions, climate tipping points, or demographic shifts with certainty.
Building the Infrastructure Intelligence System: NLP, Remote Sensing, and Spatial Analysis
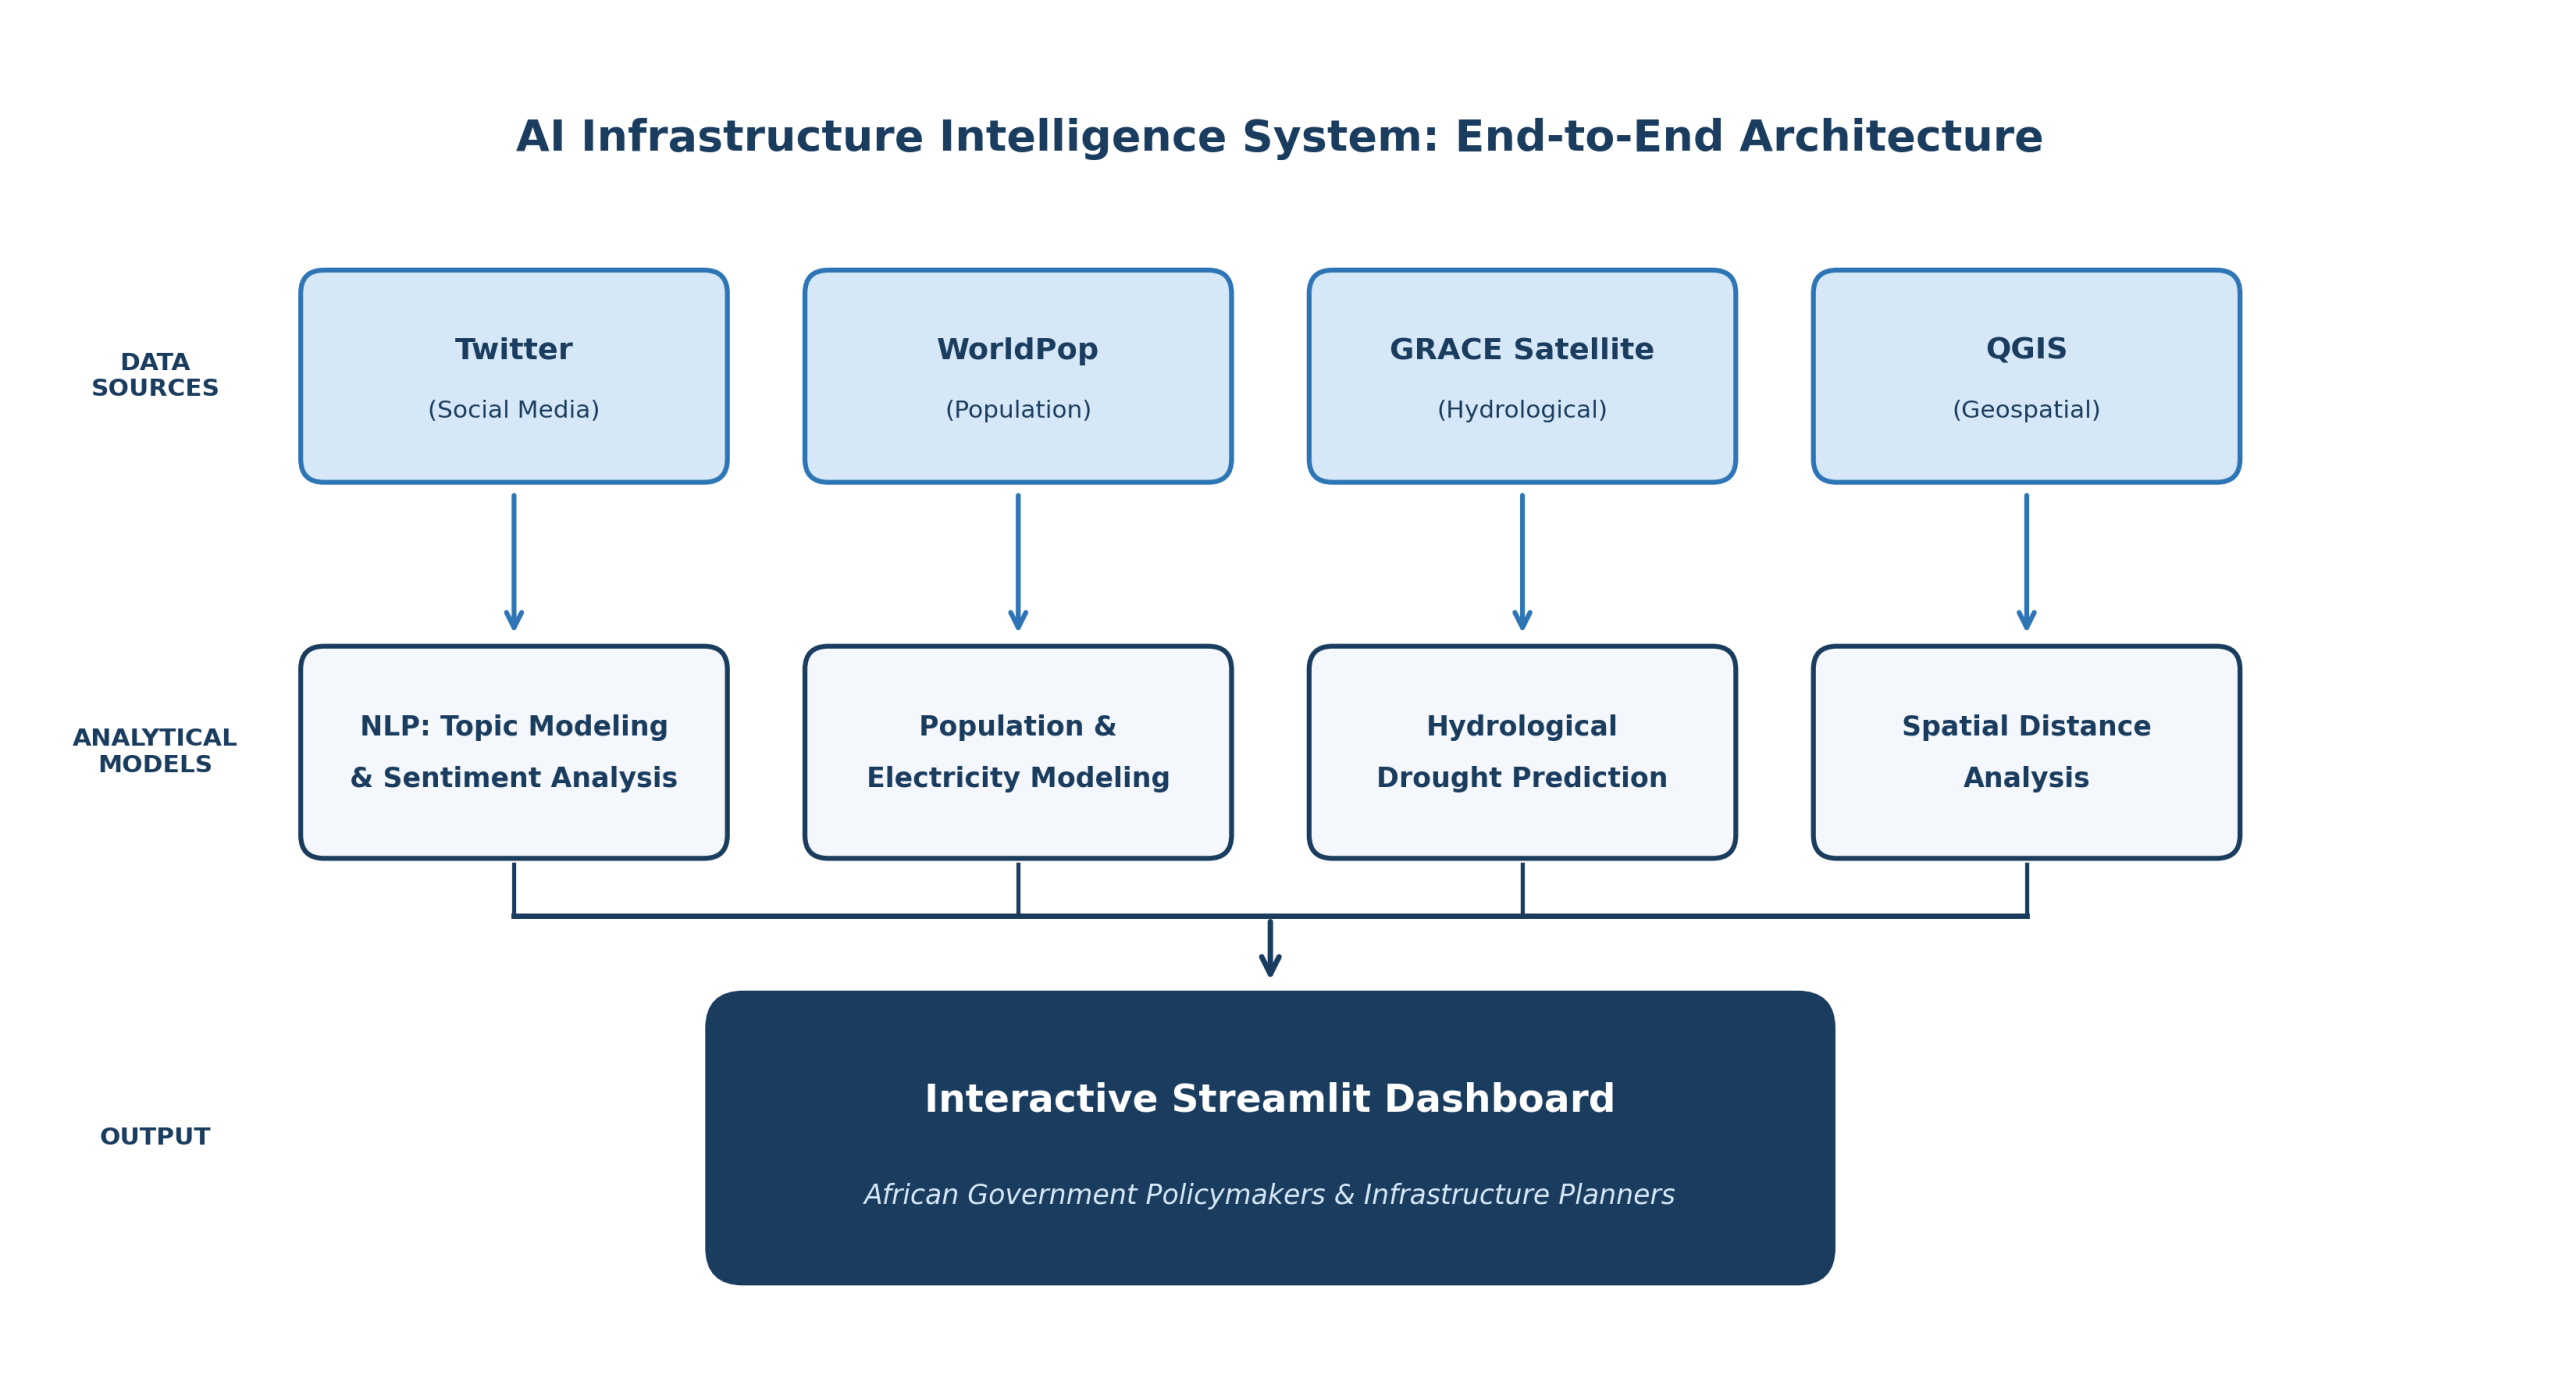
End-to-end system architecture: four data sources feed four analytical models, all consolidated into the interactive Streamlit dashboard. Image Source: omdena.
Social Media and Sentiment Analysis
The team collected Twitter data covering 14 infrastructure topics using 90 variations of African country names across 2011 to 2020. Latent Dirichlet Allocation (LDA) topic modeling grouped tweets into thematic clusters; sentiment analysis classified public opinion for Kenya and Nigeria. The analysis surfaced concerns including disability inclusion in schools, child marriage as an education barrier, and transport bottlenecks in major urban centers.
LDA was chosen because it handles large volumes of unstructured text without requiring predefined categories. The model discovers themes in the data rather than searching for known ones, making it well-suited to exploring a decade of infrastructure-related social media where the full range of topics was not known in advance.
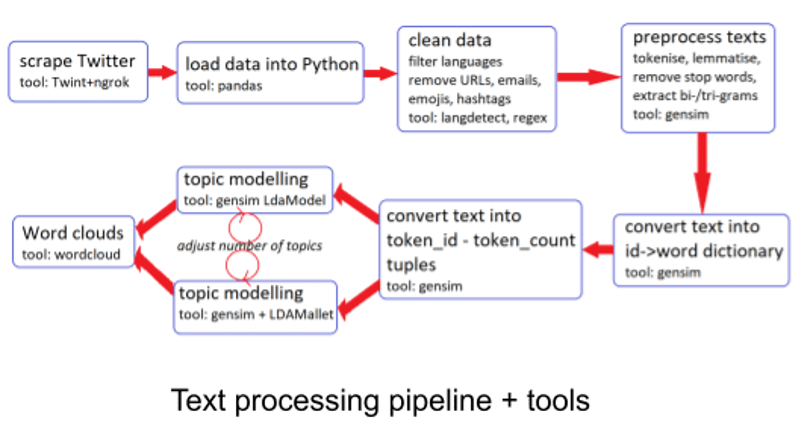
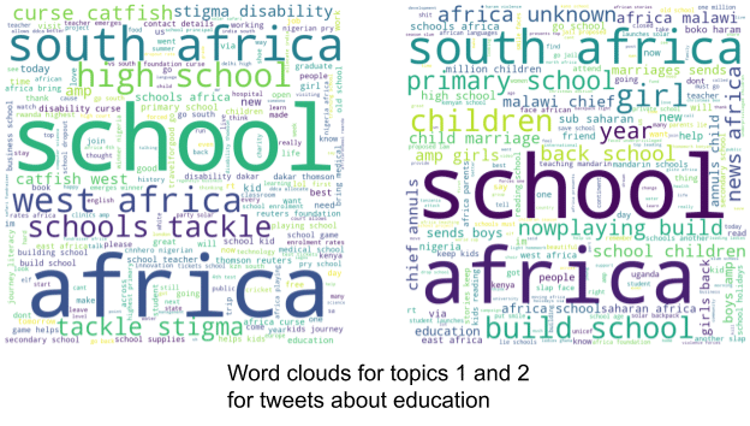
The NLP and topic modeling pipeline: from data collection through LDA modeling to word cloud visualization. Image source: Omdena.Topic modeling word clouds from the education tweet subset — showing disability inclusion and child marriage as prominent public concerns in African infrastructure discourse. Image source: Omdena.
Population and Electricity Modeling
Population density was mapped at administrative district level across East, North, and West Africa using WorldPop open-source data. Electricity access was analyzed for Burundi, Ghana, Nigeria, Benin, and Cameroon, combining historical data with predictive modeling to show where access levels were lowest and project where gaps would persist without targeted investment.
Water Stress Prediction
A hydrological drought model was developed using GRACE satellite data, predicting water stress indices for African countries with high drought risk. The model incorporated temperature and precipitation inputs across defined time frames to generate forward-looking water stress projections. These projections provided a critical input for infrastructure planning in regions where water availability was already under pressure from climate variability.
GRACE satellite data was selected because it measures changes in terrestrial water storage at regional scale, combining groundwater, soil moisture, and surface water into a single index. This makes it uniquely suited to drought prediction in regions where ground-based hydrological monitoring networks are limited or inconsistent.
Spatial Distance Analysis
Using QGIS, the team calculated distance scores between communities and key infrastructure assets for each administrative unit in Burundi: hospitals, commercial centers, powerlines, and roads. Euclidean distance was applied to point assets such as hospitals; cost distance to networked infrastructure such as roads and powerlines. The spatial analysis quantified community-level access gaps aligned with SDG indicators for health, energy, transport, and economic development.
Euclidean distance was used for hospitals and commercial centers because those are point assets accessed across open terrain. Cost distance was applied to roads and powerlines because access to networked infrastructure depends on proximity to the nearest point in the network, not a straight-line path across the landscape.
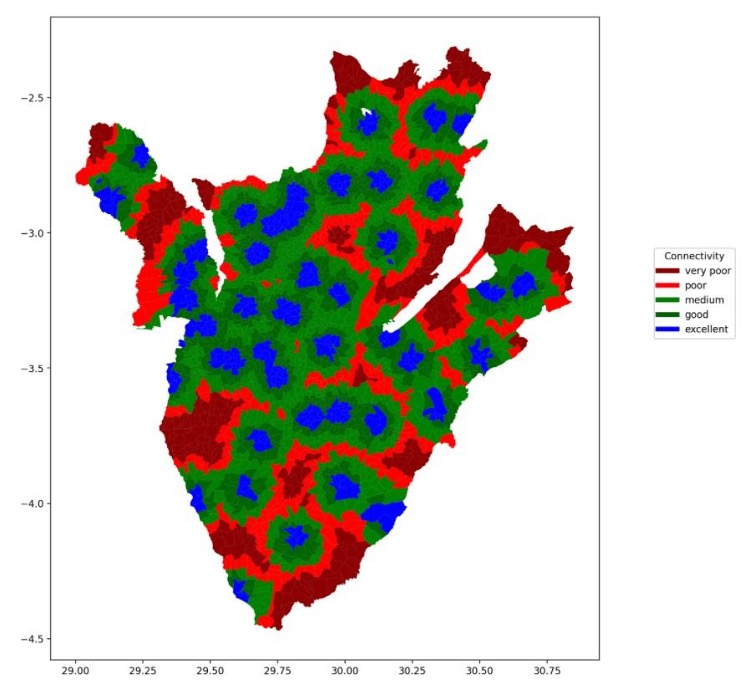
QGIS spatial analysis output showing community-level connectivity scores in Burundi — distance to hospitals, commercial centers, powerlines, and roads mapped at administrative unit level. Image source: Omdena.
What Was Delivered: An Interactive Infrastructure Planning Dashboard
The project delivered an interactive Streamlit dashboard consolidating all five analytical streams in a single interface. Policymakers and infrastructure planners could explore tweet sentiment trends by country and year, view district-level population density maps, examine electricity access data with predictions, track water stress indices over time, and assess community-level distance scores to hospitals, roads, powerlines, and commercial centers.
Across the five streams, the system processed 14 infrastructure topics spanning 10 years of Twitter data for Kenya and Nigeria; modeled electricity access and population density across five countries and three African regions; generated water stress projections for high-drought-risk African countries; and scored every administrative unit in Burundi for proximity to hospitals, roads, powerlines, and commercial centers across four SDG-aligned domains.
The dashboard was designed as a decision-support tool rather than a prescriptive system. It presented data and projections to inform judgment, not replace it. A government infrastructure planner could use it to identify which districts faced the largest gaps in hospital access, where electricity coverage was projected to remain lowest, or which regions generated the most infrastructure-related public concern on social media.
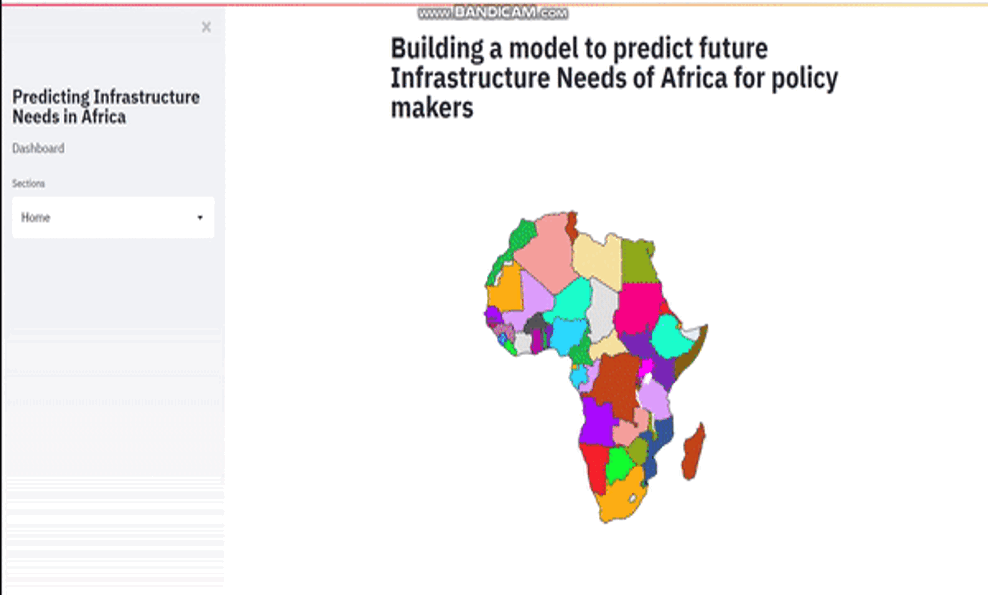
The Omdena-ACET Streamlit dashboard showing African countries mapped by region — the interface built to give government policymakers a forward-looking view of infrastructure needs.
The system translated fragmented data sources — satellite imagery, social media, population projections, and climate models — into visual maps and charts navigable through a standard web interface without requiring data science expertise. This accessibility was central to the project’s intent: analytical outputs are only useful if the people who need them can reach them.
Impact: Planning Evidence African Governments Did Not Have Before
Before this project, a government infrastructure planner wanting to understand where populations would shift, where water stress would intensify, and where infrastructure access was most limited would have needed separate engagements across satellite imagery providers, demographic datasets, and geospatial analysis teams. No single tool combined these streams for African planning contexts.
The dashboard gave ACET a data-driven instrument to strengthen its advisory work with African governments. Infrastructure investment recommendations backed by forward-looking demographic projections, sentiment-derived public concern data, and satellite-derived drought forecasts carry more analytical weight than recommendations built from historical records alone.
For district-level planners, the spatial analysis made a previously invisible pattern visible: which communities were furthest from hospitals, which were most disconnected from road networks, and which combined high population density with low infrastructure access. These are exactly the combinations that determine where infrastructure investment has the greatest impact.
Benefits for Clients: Evidence for Infrastructure Investment Decisions
For ACET, the primary benefit was an analytical instrument that did not previously exist in its advisory toolkit. Infrastructure planning conversations with African governments typically rely on economic analysis and sector reports. A platform integrating spatial data, climate projections, demographic trends, and public sentiment gives ACET differentiated evidence when advising government partners on long-term infrastructure priorities.
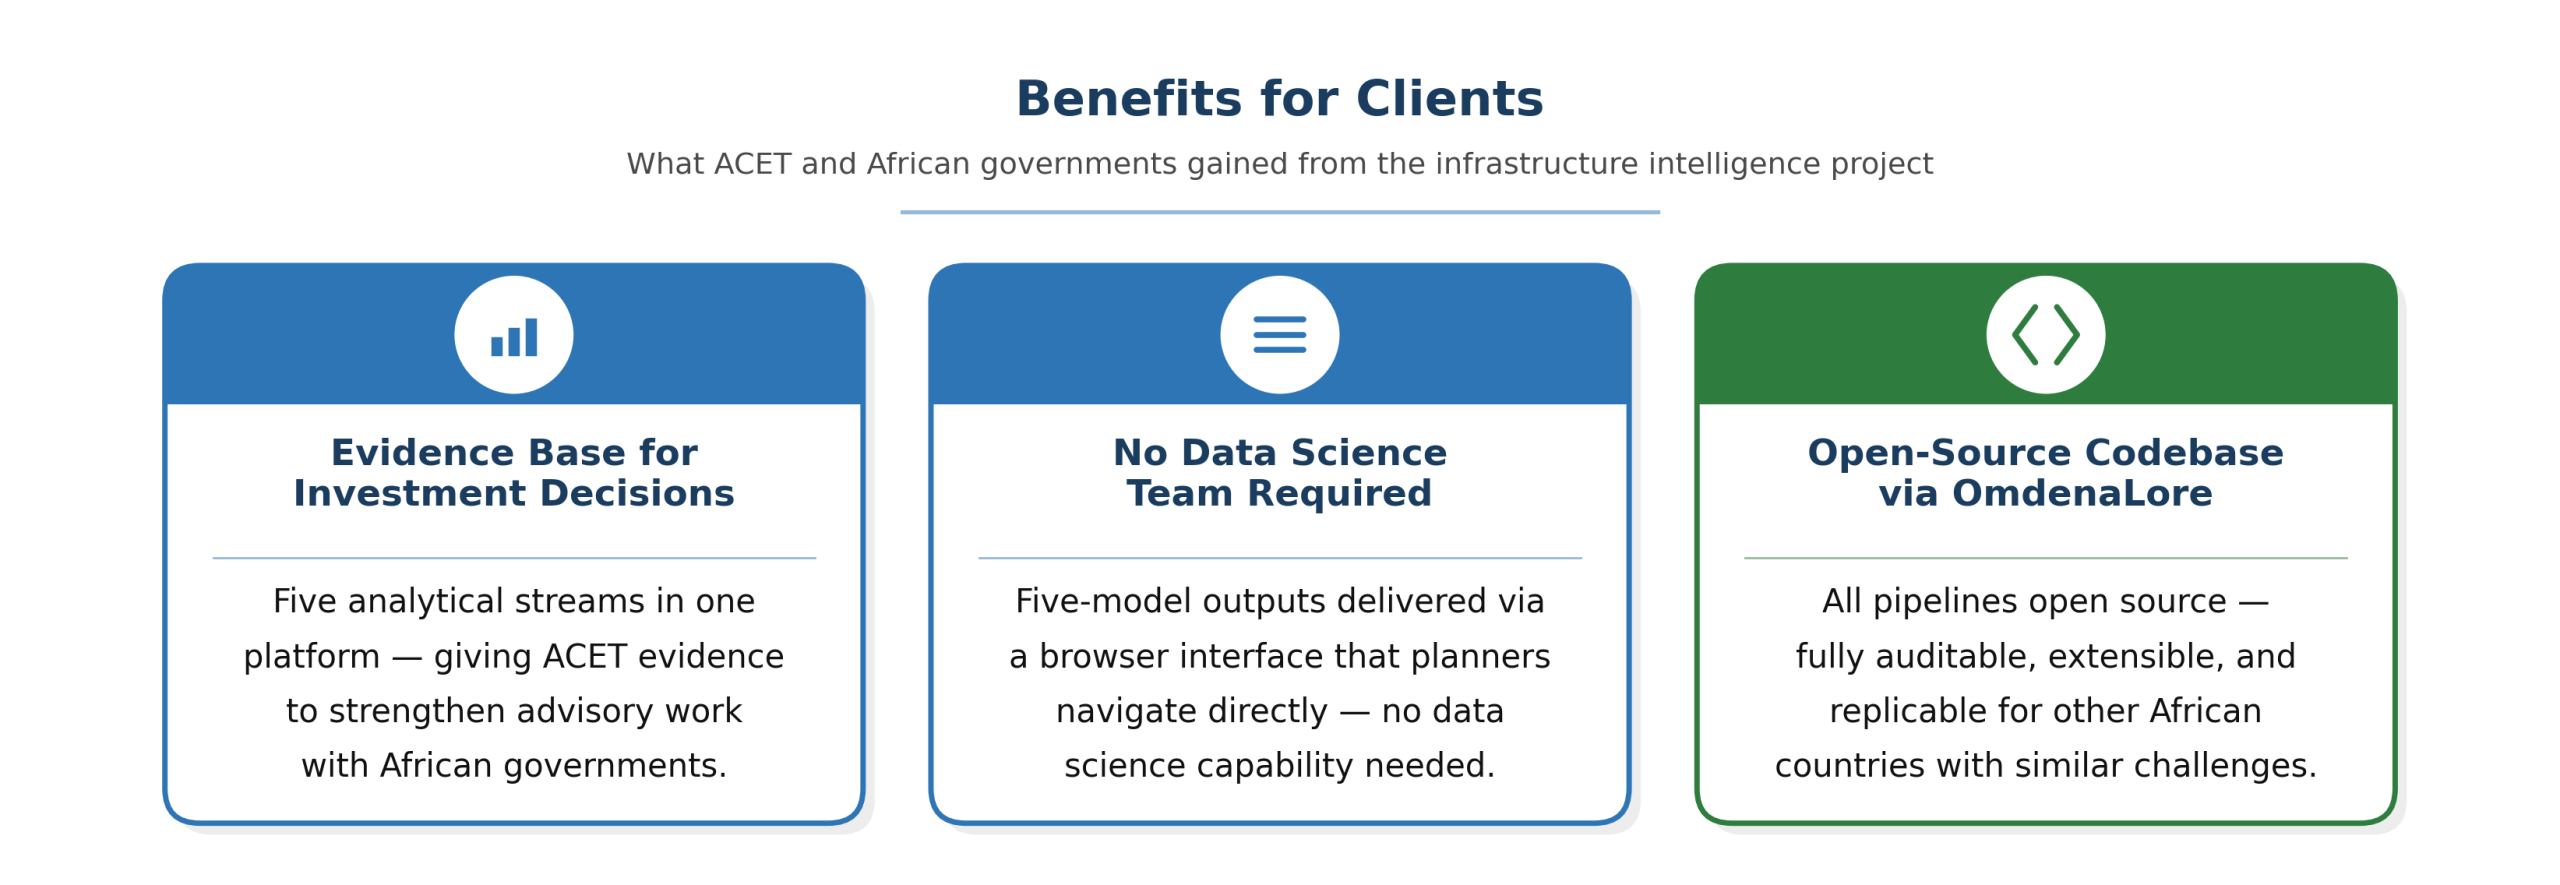
Three client benefits from the Sudan school mapping project: a deployment-ready detection model, a country-adaptable methodology, and an open-source codebase via OmdenaLore.
For African government clients, the system reduced the effort required to build a multi-domain infrastructure evidence base. District-level views of population growth, electricity access, drought risk, and infrastructure proximity organized by SDG category are accessible through a browser interface without specialist data science capability. This lowers the barrier to evidence-informed infrastructure planning at the level where investment decisions are made.
What Building an AI Infrastructure Planning Tool for African Governments Taught Us
Combining fragmented data sources reveals what no single dataset can show on its own
The project drew on Twitter data, satellite imagery, WorldPop population data, GRACE climate data, and QGIS geospatial layers. None of these, in isolation, would have produced a useful planning picture. The value came from combining them: social media captured public concern, satellite and climate data captured physical conditions, and population models showed where people were and where they were going.
Social media surfaces infrastructure concerns that official government datasets do not record
Government datasets track infrastructure assets: hospitals built, roads paved. They do not capture whether those assets are accessible, or what gaps communities experience and discuss. The Twitter analysis surfaced infrastructure concerns, from transport bottlenecks to education access barriers, that were absent from official records, adding a layer of evidence available from no government dataset.
A planning tool is only useful if policymakers without data science backgrounds can navigate it
The decision to build a Streamlit dashboard, rather than delivering model outputs as raw data files, was a deliberate design choice. The intended users were government infrastructure planners, not data scientists. Translating complex outputs from five analytical methods into an interactive, chart-based interface was what made the project’s work actionable beyond the team that built it.
What’s Next: Expanding Coverage and Infrastructure Types
The analysis piloted in this project covered a subset of African countries across four infrastructure domains. Expanding country coverage, applying the same modeling pipeline to additional nations, is the natural next step toward a continental-scale infrastructure planning system. Each additional country requires country-specific data sourcing and local calibration, but the modeling framework was designed to accommodate this.
More granular geospatial data would improve the spatial analysis component. Current distance calculations used Euclidean methods (straight-line approximations) because detailed road network data sufficient for routing-based analysis was not available for all areas. As African open-data infrastructure develops, routing-based distance calculations become possible, providing more accurate estimates of real community access to roads, health facilities, and commercial services.
Key Achievements
Interactive Infrastructure Planning Dashboard
A Streamlit web application giving African government policymakers access to five AI-generated data streams (social media sentiment, population density, electricity access projections, water stress forecasts, and spatial distance scores) through a standard browser interface. No data science expertise required to navigate or interpret the outputs.
Ten-Year Public Infrastructure Sentiment Index
A structured record of 10 years of Twitter discourse on 14 infrastructure topics for Kenya and Nigeria, classified by topic and public sentiment. Surfaced concerns — including disability inclusion in schools, child marriage as an education barrier, and urban transport bottlenecks — absent from official government datasets.
District-Level Infrastructure Access Deficit Map
Euclidean and cost-distance scores for every administrative unit in Burundi measuring proximity to hospitals, commercial centers, powerlines, and roads, aligned with SDG indicators. Built as a replicable methodology designed for expansion to additional African countries as geospatial data becomes available.
About the Project
This case study describes a collaborative AI challenge between Omdena and the African Center for Economic Transformation (ACET). The project built a multi-method AI system combining Twitter NLP, population and electricity modeling, hydrological drought prediction, and spatial infrastructure gap analysis, and delivered an interactive Streamlit dashboard designed to give African government policymakers forward-looking evidence for infrastructure investment decisions. Fifty collaborators contributed to the challenge.
FAQ
What is ACET and why did it initiate this project?
ACET works with African governments on the policies and investments needed to shift economies from commodity dependence toward diversified, sustainable growth. Infrastructure planning sits at the center of that agenda. ACET brought this project to Omdena because it needed data-driven evidence of where future populations, water stress, and economic activity would concentrate, not estimates based on today's conditions.
What infrastructure types does the dashboard cover?
The dashboard covers transport, education, finance, energy, and water through its NLP analysis of social media data. Its spatial component maps community access to hospitals, commercial centers, powerlines, and roads. Electricity access modeling covers Burundi, Ghana, Nigeria, Benin, and Cameroon, with water stress projections produced for high-drought-risk African countries.
How was Twitter data used to identify infrastructure needs, and what did it find?
Tweets mentioning Africa or specific African countries paired with infrastructure keywords were collected from 2011 to 2020. Topic modeling grouped tweets by theme; sentiment analysis classified public opinion as positive, negative, or neutral. Analysis of Kenya and Nigeria surfaced concerns including disability inclusion in schools, child marriage as an education barrier, and road and airport transport as dominant urban themes.
How far ahead can the system predict infrastructure needs?
The system generates projections based on population trends, climate data, and electricity access modeling rather than fixed-date forecasts. These are intended to inform planning decisions spanning 20 to 50 years, consistent with the working life of major infrastructure assets. The dashboard presents evidence to inform judgment rather than to produce precise predictions; long-range projection carries inherent uncertainty.
Can this approach be applied to other African countries?
Yes, the modeling framework was designed with replication in mind. Expanding to additional countries requires country-specific Twitter data, local geospatial datasets for the spatial component, and relevant open-source population and electricity data. The Burundi spatial analysis was explicitly framed as a pilot methodology intended for wider application as geospatial data for other African countries becomes available.
Share this article
Share on LinkedIn, send by email, or copy the direct link.