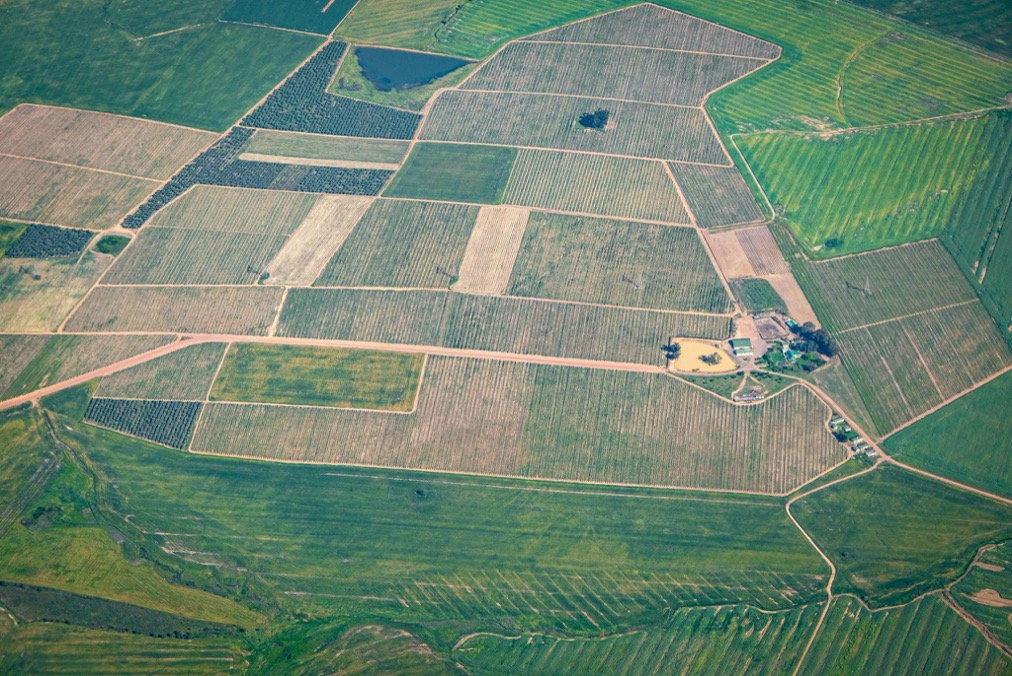
In Senegal, harvest surveys arrive too late to act on. This project replaced them with two satellite-based pipelines: a CNN-LSTM model that generates department-level yield maps before the harvest season closes, and a SARIMA pipeline that delivers mid-season estimates of crop yield from NDVI data alone.
Watch the Webinar
See how AI and satellite data can improve crop yield prediction.
In this webinar, we walk through the approach, data, and AI models behind the project, along with its key findings and practical applications for agricultural decision-making.
Executive Summary
Accurate crop yield forecasting is critical for strengthening food security and improving agricultural planning at scale. In Senegal, timely knowledge of what crops are growing and how much yield to expect remains essential for decision-making across the agricultural sector. This project, built by the Omdena team in partnership with the Global Partnership for Sustainable Development Data, constructed an end-to-end satellite intelligence system capable of predicting crop yields across all fourteen Senegalese departments for three staple crops: Maize, Millet, and Rice. The system runs entirely on freely available satellite data and open-source tools, eliminating the need for costly on-the-ground surveys.
Two parallel prediction pipelines were developed. The first uses a CNN LSTM deep learning architecture trained on spectral and temperature histograms derived from MODIS satellite imagery, with transfer learning from South Sudan and Ethiopia, reducing test set MSE for Maize from 0.2094 to 0.0849, a 59 percent improvement over training on Senegalese data alone. The second uses SARIMA time series forecasting of NDVI signals to produce yield estimates before the harvest season ends, achieving an absolute error of less than 25 percent for most Senegalese regions in the 2018 Sorghum validation year. Together, they deliver georeferenced yield estimates scalable to any district with satellite coverage.
The Problem: When the Yield Post-Harvest Data Arrives, It’s Already Too Late
Senegal depends heavily on smallholder agriculture, with Maize, Millet, and Rice accounting for the bulk of domestic food production across markedly different agroclimatic zones — from the dense groundnut belt of the west to the irrigated river plains of the north and the mixed crop systems of the south.
Reliable crop yield data is essential for everything from national food security planning to targeted subsidy distribution, import timing, and climate adaptation policy. Yet the dominant source of that data in Senegal and across much of Sub-Saharan Africa remains farmer self-reporting through seasonal surveys: a method that is slow, expensive, geographically uneven, and difficult to verify at scale.
Survey-based yield estimates are collected months after the harvest season ends, making them useless for in-season intervention. They suffer from response bias, sampling gaps in remote agricultural areas, and inconsistent collection methods across departments. For policymakers who need to act before food shortages compound into crises, the data arrives too late and with too little geographic resolution to be operationally useful.
Satellite imagery changes the calculus entirely. Satellites continuously observe the entire national territory at no incremental cost per hectare, producing spectral signals that reliably correlate withvegetation health andcrop biomass. The technical challenge is not data access but building the pipeline that translates raw spectral observations into calibrated yield estimates tied to specific crop types, specific departments, and specific seasons. That is what this project set out to build.
The Data Challenge: Sparse Ground Truth and Unreliable Cropland Maps
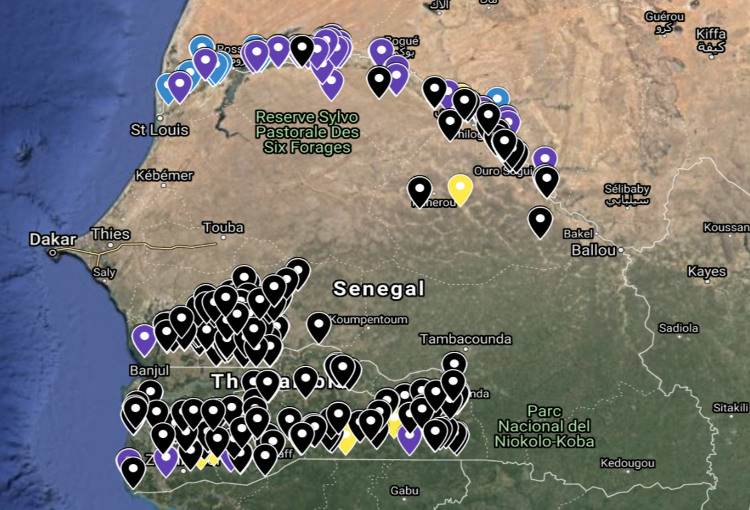
The most consequential constraint this project faced was not computational but epistemic: the available ground truth for Senegal was severely limited. The primary source was the IPAR dataset, which provided GPS-located yield records for multiple crops but only for the year 2014. A deep learning model trained on a single year of sparse, geographically concentrated observations has no reliable way to distinguish genuine crop-yield relationships from historical coincidences of that particular growing season.
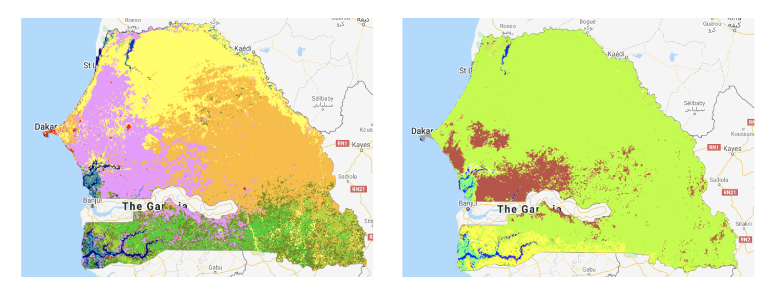
Land cover masking introduced a second challenge. Standard practice is to apply a cropland mask to satellite imagery, removing non-agricultural pixels before training. The most commonly used product for this, MCD12Q1.006 MODIS Land Cover, proved unreliable for Senegal: its cropland classifications did not match observed agricultural areas across several departments.
The team switched to the Copernicus Global Land Service layer, which provided more accurate boundaries for the region. The substitution resolved the classification problem but required revalidating the full preprocessing pipeline before training could proceed.
Figure 1: IPAR ground truth GPS locations across Senegal for Maize, Millet, Rice, and other crops. Ground truth points are geographically concentrated, with limited coverage across the north and east — directly shaping the model’s capacity to generalise to undersampled regions.Figure 2: Side-by-side comparison of MODIS land cover (left) and Copernicus land cover (right) for Senegal. The MODIS product misclassifies significant cropland areas; the Copernicus dataset aligns substantially better with IPAR ground truth locations.
How the Two-Pipeline System Was Designed Around Senegal’s Data Constraints
To address the scarcity of IPAR data, two strategies were applied to the deep learning pipeline in parallel. Transfer learning drew on yield records from South Sudan and Ethiopia, giving the model a pre-training signal before fine-tuning on Senegalese data. Sliding spatial window augmentation expanded the training set by generating additional samples around each GPS point, on the assumption that neighbouring pixels share similar yield conditions.
For the time-series pipeline, a separate regional yield dataset from OpenDataForAfrica was used, covering 2016 to 2019 and providing greater temporal depth. Each strategy addressed data scarcity differently, and neither fully resolved it — a constraint the team acknowledged and built around rather than obscured.
Satellite Imagery and the Phenological Signal Behind Every Prediction
The project drew on two primary satellite datasets, both accessed through Google Earth Engine. Surface reflectance came from MOD09A1.006 Terra, a MODIS product delivering eight-day composite imagery at 500-metre resolution across seven spectral bands. Land surface temperature came from MYD11A2.006 Aqua, providing eight-day thermal observations at one-kilometre resolution. Together, they capture two complementary signals: the greenness trajectory of vegetation and the thermal environment in which crops develop.
The normalized difference vegetation index, NDVI, is the central derived signal throughout the project. Computed from near-infrared and red reflectance bands, NDVI tracks vegetation density and photosynthetic activity across time. Its value for yield prediction lies not in any single observation but in the time series it produces across a growing season. Different crops have distinct phenological signatures: they emerge, grow, peak, and senesce at different rates and timings. NDVI time-series data encodes these signatures, allowing a model trained on historical yield records to link spectral trajectories to expected tonnes per hectare.
Aligning satellite observations with the correct growing windows required using Senegal’s FAO crop calendar, which varies by crop type. For Maize, the relevant window runs approximately weeks 19 to 30; Millet and Rice follow different schedules. Using imagery outside the growing season introduces noise without a predictive signal. All datasets were filtered to the relevant growing period before any feature extraction or model training, ensuring that the spectral features used to train the models encode crop development rather than fallow or post-harvest conditions.
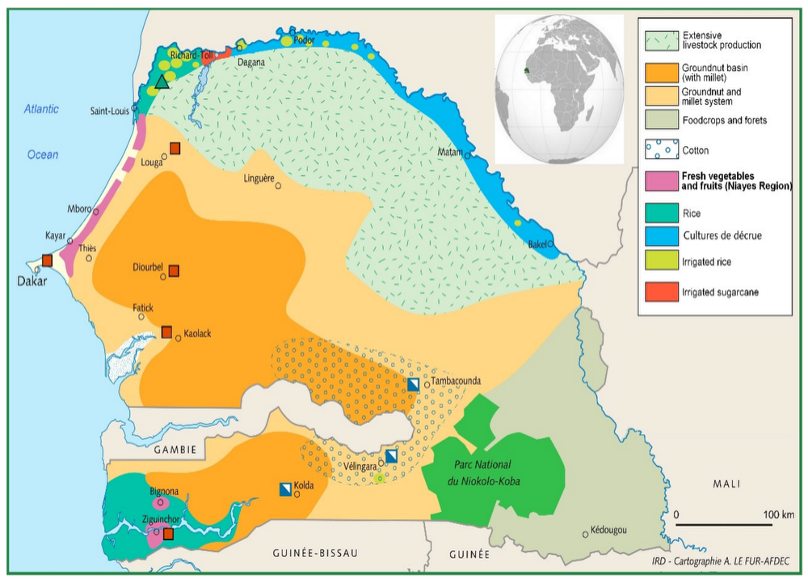
Fig.3: Agricultural production zones across Senegal. Crop types and growing systems vary significantly by region — from the groundnut basin of the centre-west to rice cultivation along the northern river plains — shaping which satellite signals are most predictive for each district.
Why One Pipeline Could Not Answer Both Questions
Rather than committing to a single modelling paradigm, the project developed two independent prediction pipelines that operate on overlapping yet distinct data representations.
The first is a supervised deep learning pipeline using a CNN-LSTM architecture applied to spectral-thermal histograms, requiring labelled yield ground truth for training.
The second is a time-series pipeline that uses SARIMA models to forecast NDVI trajectories and infer yield from the forecast signal, requiring no crop yield labels at prediction time. Running both gave the team a direct read on the accuracy, data, and timeliness trade-offs that any real deployment must navigate.
Inside the Pipelines: Transfer Learning, SARIMA, and the Decisions Behind Each
Deep Learning Pipeline: CNN-LSTM with Transfer Learning
The deep learning approach was grounded in an architecture first validated for county-level soybean yield prediction: a CNN-LSTM model that processes spatial patterns through convolutional layers before capturing temporal dynamics through an LSTM sequence model. Applied to Senegal, this architecture needed to generalise across a far more data-scarce environment than its original context.
Feature Representation: 3D Histograms Over Raw Imagery
Why histograms rather than raw images? Instead of feeding raw satellite image patches into the model, the pipeline converted each satellite observation into a three-dimensional pixel-count histogram that aggregated spectral and temperature values across the crop-masked region of interest.
This representation is more compact, less sensitive to exact spatial alignment, and substantially reduces the risk of overfitting on limited ground truth data. The histogram captures the statistical distribution of spectral conditions across a region, without requiring the model to learn from pixel-level spatial patterns that may not generalise across departments.
Multi-band inputs. Histograms were generated from the surface reflectance bands of MOD09A1 and the temperature bands of MYD11A2, masked to cropland pixels using the Copernicus land cover layer and aligned to the relevant growing season windows from the FAO crop calendar. Stacked across time steps within the growing season, these histograms form the temporal input sequence fed into the LSTM component of the architecture.
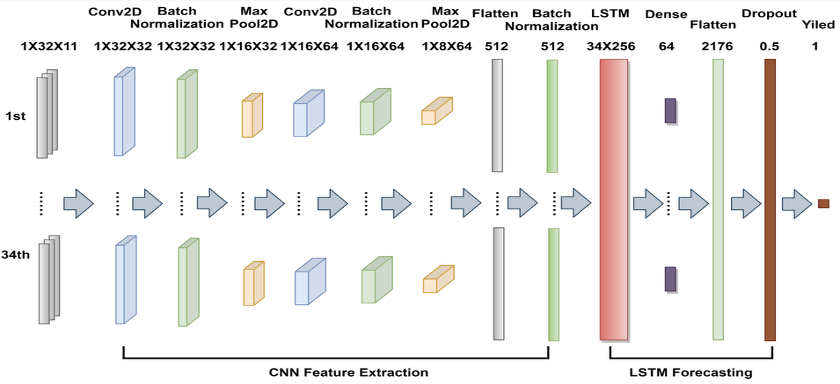
Figure 4: CNN-LSTM architecture. Each time step’s histogram is processed through two convolutional blocks (Conv2D, Batch Normalisation, MaxPool2D) to extract spatial features, which are then flattened and fed into an LSTM to model temporal dynamics across the 34 growing-season timestamps before a Dense layer outputs the yield prediction.
Transfer Learning and Data Augmentation
Cross-country pre-training. With only a single year of IPAR ground truth available for Senegal, the model was first pre-trained on yield records from South Sudan and Ethiopia, where comparable labelled data were available from an existing deep transfer-learning crop prediction dataset. Pre-training gave the model a generalised understanding of the relationship between spectral-thermal histograms and yield outcomes before it encountered Senegal-specific supervision. T
The model was then fine-tuned on IPAR Senegal data, adapting the learned representations to local crop varieties and agroclimatic conditions.
Sliding window augmentation. To expand the training set beyond the IPAR GPS points, the team applied spatial data augmentation. For each labelled location, additional training samples were generated by sliding windows around the original coordinates, assuming that yield conditions in immediately neighbouring pixels were similar to those at the ground-truth point.
This is a documented technique for small-sample remote sensing problems and produced measurable improvements in training stability without requiring additional field data collection.
Results: Where Transfer Learning Made the Difference
Maize. Transfer learning produced the largest measurable improvement for Maize. The CNN-LSTM pre-trained on Ethiopia and South Sudan data and then fine-tuned on IPAR Senegal data achieved a test-set MSE of 0.0849 — compared with 0.2094 for a model trained only on IPAR 2014 data. That is a 59 percent reduction in error, driven entirely by the richer pre-training signal rather than any architectural change.
Millet. The Millet model achieved a test-set MSE of 0.1293 on IPAR data, a moderate result that did not benefit from transfer learning to the same degree as Maize. The difference likely reflects a smaller ground-truth sample for Millet and greater agroclimatic variability in Millet-growing regions than in the agroclimatic conditions captured in the pre-training data from South Sudan and Ethiopia.
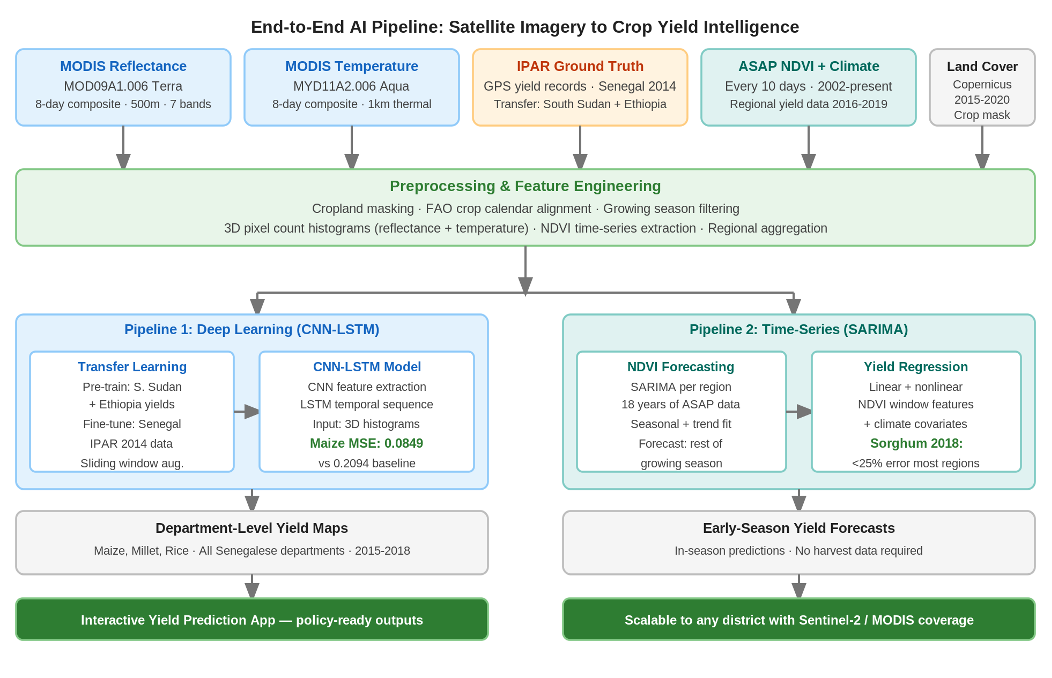
Figure 5: End-to-end system pipeline from satellite data acquisition through preprocessing and dual-pipeline modelling to department-level yield maps and the interactive prediction application.
Time-Series Pipeline: SARIMA Forecasting of NDVI and Yield
The time-series pipeline was designed around a different operational question: can yield be estimated earlier in the season, before harvest data is available, by forecasting the NDVI trajectory and inferring yield from that forecast? If so, policymakers could receive preliminary estimates while the growing season is still active, enabling earlier intervention.
This required two linked models: one to forecast NDVI, and one to translate the forecast NDVI into a yield estimate.
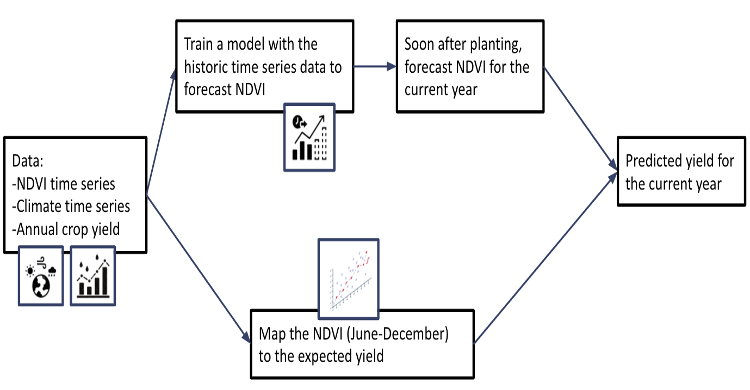
Figure 6: Time-series pipeline overview. Historical NDVI and climate data are used to train a SARIMA forecasting model that projects NDVI for the current season. A separate regression model then maps the forecast NDVI window to expected yield — enabling predictions before harvest data are available.
NDVI Forecasting with SARIMA
Data and regional scope. The NDVI input came from the ASAP dataset, which provides observations every 10 days starting in 2002, giving the model nearly two decades of historical NDVI data at the regional level. SARIMA models were trained independently for each Senegalese region to capture region-specific seasonal patterns, trend components, and error structures.
The team also evaluated SARIMAX with climate covariates, as well as DNN and LSTM alternatives, finding that SARIMA provided a reliable and computationally efficient baseline.
Forecast quality. SARIMA forecasts for the holdout period captured the broad seasonal trajectory of NDVI—including the timing of the growing-season peak and the rate of senescence—reasonably well for regions with moderate interannual NDVI variability. Regions with more erratic patterns, driven by irregular rainfall, wereharder to forecast.
The forecasted NDVI series were then fed into the second stage as synthetic inputs, replacing observed NDVI values to simulate the in-season prediction scenario.
From NDVI Forecast to Yield Estimate
Feature construction. For each region and year, a set of NDVI-derived features was computed: maximum NDVI during the season, cumulative NDVI summed across the growing window, NDVI windows corresponding to early, mid, and late growing periods, and analogous features from rainfall and temperature time series. These features served as inputs to both linear and nonlinear regression models predicting annual regional yield.
Sorghum results. For Sorghum, the linear regression model achieved an absolute error of less than 25 percent for most Senegalese regions in the 2018 validation year. The 2019 test year was harder: Sorghum yields in 2019 were anomalously high, and the model — trained on 2016 to 2018 patterns — could not predict such an extreme value. This failure illustrates the core risk of all yield forecasting from limited historical data: generalising across anomalous climate years is only possible if the training set includes comparable anomalies.
Maize time-series. Maize yield prediction using the regional time-series approach did not perform as well as the deep learning pipeline, consistent with Maize being more spatially variable and more dependent on local soil conditions, which the regional NDVI signal does not capture. This cross-method comparison was valuable precisely because it pointed to where deep learning adds genuine lift over simpler methods — and where it does not.
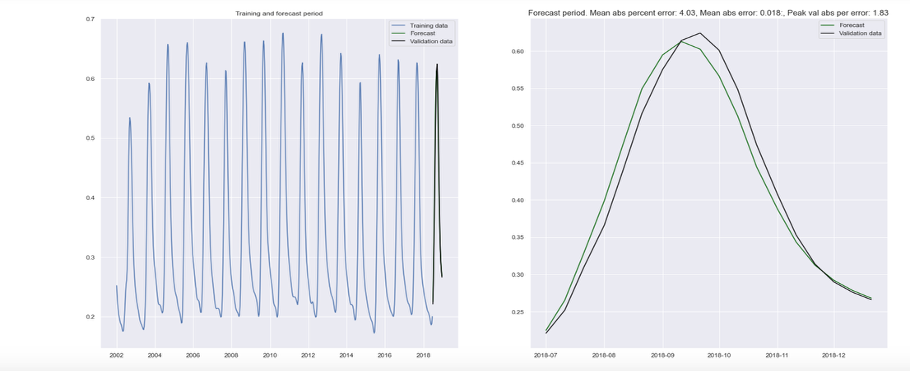
Figure 7: SARIMA NDVI forecast for Kaffrine region. The left panel shows the full 18-year training history and forecast window. The right panel zooms into the 2019 forecast period, showing that the model closely tracks the seasonal NDVI trajectory, validating the approach as a basis for in-season yield inference.
Results: Maize Error Cut by 59%, Sorghum Forecasts Within 25% Across All Departments
Yield predictions were generated for Maize, Millet, and Rice across all Senegalese departments from 2015 to 2018. For Maize, the CNN-LSTM with transfer learning delivered the strongest result: a test-set MSE of 0.0849, compared to 0.2094 for the IPAR-only baseline, confirming that cross-country pre-training is the most important single lever when domestic ground truth is limited to a single year.
For Sorghum, the SARIMA-based time-series approach achieved sub-25 percent error rates across most regions in 2018, making it operationally useful for in-season policy planning despite its limitations in anomalous years such as 2019.
The two pipelines are complementary rather than competing. The deep learning model is more accurate for crops with sufficient similarity to the transfer-learning source domains and produces its best estimates from full growing-season imagery.
The SARIMA pipeline trades some accuracy for operational earliness. Because it uses only historical NDVI series and a yield regression model, it can produce preliminary forecasts while the current season is still active. Together, the two pipelines give decision-makers an early warning signal and a more precise post-season estimate from the same satellite infrastructure.
Honest assessment of the results requires acknowledging what data limitations prevent. A single year of IPAR ground truth constrains what any model can learn about Senegalese conditions. The 2019 Sorghum generalisation failure is a clear illustration: without anomalous years in the training set, the model has no way to anticipate them in production.
These are not failures of methodology but of data availability — and they point directly to where future investment in ground-truth collection would yield the largest gains in prediction quality.
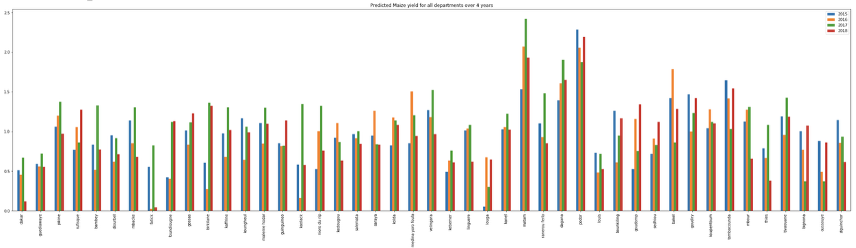
Figure 8: Predicted Maize yield (T/ha) for all Senegalese departments across four years (2015-2018). Each cluster of bars represents one department; colour encodes the year. The variation across departments and years reflects real agroclimatic differences captured by the CNN-LSTM model.
Model performance summary
Model / Approach
Crop
MSE (Test Set)
Key Finding
CNN-LSTM + Transfer Learning
Maize
0.0849
Best result — 59% lower error than IPAR-only training
CNN-LSTM (IPAR 2014 only)
Maize
0.2094
Baseline — limited by single-year ground truth
CNN-LSTM (IPAR data)
Millet
0.1293
Moderate result — less transfer learning benefit
SARIMA + NDVI Regression
Sorghum
<25% abs. error
Most regions’ 2018 — 2019 anomaly was not captured
What Earlier Yield Intelligence Changes for Food Security Planning
Prediction accuracy is a necessary condition for impact, not a sufficient one. The system was designed with operational deployment in mind: outputs reach non-technical agricultural officers through an accessible application, and the forecasting pipeline delivers estimates on a timeline that gives policymakers room to act.
From Model to Policy: The Interactive Prediction App
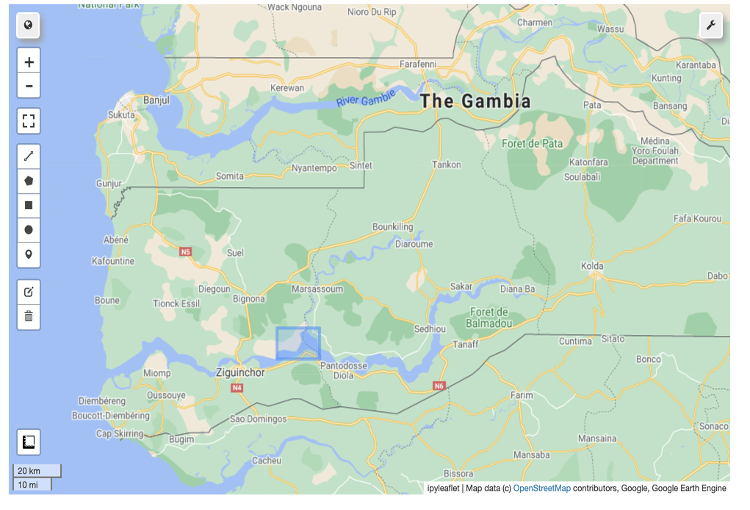
Machine learning predictions only matter if decision-makers can access them. The project addressed this by converting the CNN-LSTM prediction pipeline into an interactive web application built on Jupyter. It was delivered through Voila, a tool that transforms Jupyter notebooks into standalone, browser-accessible applications that require no Python knowledge to operate. A user can open the app, select a region of interest by drawing on an interactive map, choose a year and crop type, and receive a yield estimate without writing a single line of code.
The technical flow underneath the interface is the full prediction pipeline condensed into a guided interaction. Once a region is selected, the app retrieves the corresponding satellite imagery from Google Earth Engine, generates the three-dimensional spectral histograms, passes them through the pre-trained CNN-LSTM model, and renders the yield estimate alongside a spatial visualisation of predicted values across the selected area. An alternative input mode accepts GPS latitude and longitude coordinates directly, allowing the same prediction to be triggered from field survey records without manual map interaction.
This matters for the case study, not as a demonstration of Jupyter widget capability but as a systems design choice. Prediction models that require a data scientist to operate cannot scale to district agricultural officers or government planning departments. Wrapping the ML pipeline in an accessible interface is what separates a research experiment from a deployable policy tool. Because the pipeline runs on GEE’s cloud infrastructure, adding a new district or crop year requires no local compute, no data download, and no code changes on the end user’s side.
Figure 9: Interactive map interface of the yield prediction app. The user draws a region of interest directly on the satellite map—here, southern Senegal—triggering the GEE image retrieval, histogram generation, and CNN-LSTM inference pipeline, which returns the district yield estimate.
What This System Makes Possible
Senegal produces over 1.5 million tonnes of cereals annually, with smallholder farmers accounting for most of that production across highly variable agroclimatic zones. The system built here offers concrete capabilities that survey-based approaches cannot match.
National and regional agricultural ministries can generate department-level yield estimates before the harvest season ends, enabling pre-positioned food aid, import planning, and price stabilisation interventions weeks earlier than survey-based timelines allow.
The SARIMA forecasting component can deliver preliminary yield signals mid-season using only NDVI time-series history and no current-season ground truth, giving policymakers an early warning system for shortfall years at near-zero marginal cost per forecast.
The CNN-LSTM architecture is replicable to any crop with available ground truth in a climatically similar country, allowing transfer learning to bring new crop models online without requiring multi-year domestic labelling campaigns before the first usable prediction.
The interactive Voila application brings district-level yield queries within reach of non-technical agricultural officers, removing the data science barrier that typically prevents ML outputs from reaching the people closest to the problem.
The methodological framework for combining supervised deep learning and unsupervised time-series forecasting in a data-scarce environment is directly applicable to other Sub-Saharan countries with similar ground truth limitations and equivalent MODIS or Sentinel-2 coverage.
Lessons Learned
Two Pipelines Outperform One When the Operational Questions Differ
The CNN-LSTM and SARIMA pipelines are not competing answers to the same question. The deep learning pipeline delivers the most accurate end-of-season yield estimates for crops where transfer learning can supply a strong pre-training signal. The SARIMA pipeline delivers preliminary yield signals mid-season, before harvest data exists, giving policymakers a weeks-earlier window for intervention.
The decision to build both, rather than choose between them, was the most consequential architectural call the project made. The right framing is not which pipeline performs better, but which pipeline answers which question.
Transfer Learning Is the Correct Response to Ground Truth Scarcity, Not a Workaround
With only a single year of IPAR ground truth for Senegal, transfer learning was what made the CNN-LSTM viable. Pre-training on Ethiopia and South Sudan, then fine-tuning on Senegalese data, reduced test-set MSE for Maize by 59 percent, from 0.2094 to 0.0849.
The lesson is not that data scarcity can be worked around, but that it should redirect effort toward identifying climatically comparable source domains where labelled data already exists. The transfer learning benefit is largest when source and target domains share agroclimatic characteristics.
Land Cover Products Need Validation Before Use as Training Masks
The original plan was to mask non-cropland pixels using MCD12Q1.006 MODIS Land Cover. Field verification showed it was unreliable for Senegal: its cropland boundaries did not match observed agricultural areas across several departments. Switching to the Copernicus Global Land Service layer resolved the issue but required revalidating the full preprocessing pipeline.
Land cover quality varies significantly by geography and is rarely treated as a project risk. Any pipeline where a cropland mask feeds training data needs to validate that mask against local ground reference before trusting it.
From Senegal to the Sahel: Ground Truth, Geography, and Early Warning Integration
The binding constraint on CNN-LSTM performance is a single year of IPAR ground truth. One year of observations cannot capture interannual yield variability, and the 2019 Sorghum generalisation failure illustrates the consequence directly: a model trained on 2016 to 2018 patterns could not predict anomalously high yields in 2019.
Expanding the ground truth dataset, through multi-year IPAR survey campaigns or GPS-located yield records from national agricultural statistics, is the highest-value next step for improving both pipelines. With three or more years of labelled data, the model can learn the range of yield variability rather than approximating it from a single season.
The geographic expansion path is direct. The methodology was built on MODIS and ASAP datasets that cover all of Sub-Saharan Africa, and the SARIMA component requires no ground truth for initial deployment.
Applying the framework to Mali, Burkina Faso, and Niger, where smallholder cereal production faces comparable food security pressures, would extend early-warning capability across the Sahel with modest adaptation. The primary requirement is a validated cropland mask for each new country, as the Senegal experience confirmed that land cover products need local verification before use.
The longer-term integration step is connecting model outputs to national early warning systems. The SARIMA pipeline already produces what these systems need: regional yield estimates generated mid-season, before harvest data is available, at near-zero marginal cost per forecast. Integrating with FEWS NET, the FAO Global Information and Early Warning System, or equivalent national programs would move the pipeline from research output to operational infrastructure.
As satellite resolution improves beyond MODIS’s 500-metre pixel size, the same pipeline architecture can scale from department-level to field-level predictions, extending coverage to the smallholder plots where the food security risk is highest.
About the Project
This project was completed by Omdena in partnership with the Global Partnership for Sustainable Development Data (GPSDD), with a global team of AI engineers contributing across data engineering, model development, time-series analysis, and application deployment. The work applied satellite remote sensing, deep learning, and scalable cloud computing to address one of the most data-scarce and operationally significant prediction problems in Sub-Saharan agriculture: reliable crop yield estimation for smallholder-dominated landscapes.
If you are working on food security intelligence, satellite-based yield estimation, or agricultural AI systems in data-scarce environments,reach out to the Omdena team to discuss how this methodology applies to your context.
FAQ
Why use MODIS rather than Sentinel-2 for this project?
MODIS provides eight-day composite imagery with global coverage dating back to 2000, giving the time-series pipeline nearly two decades of historical NDVI signal to train on. Sentinel-2 offers higher spatial resolution but has only been operational since 2015. For the SARIMA forecasting approach, which depends on long historical records, MODIS is the appropriate choice. A future iteration could combine both sources, using MODIS for long-term time-series modelling and Sentinel-2 for higher-resolution spatial predictions.
What is transfer learning, and why was it necessary here?
Transfer learning involves pre-training a model on a related dataset before fine-tuning it on the target dataset. Here, the CNN-LSTM was first trained on yield records from South Sudan and Ethiopia, then fine-tuned on Senegal's IPAR dataset. This was necessary because a single year of domestic ground truth is insufficient to train a deep learning model from scratch. Pre-training gave the model a general understanding of the spectral-yield relationship that local fine-tuning could then adapt to Senegalese conditions — reducing Maize test-set MSE by 59 percent compared to training on IPAR data alone.
Why did the team switch land cover datasets from MODIS to Copernicus?
The MCD12Q1.006 MODIS land cover product is widely used in the literature. Still, a comparison with IPAR ground-truth locations revealed that its cropland classification did not match where crops were actually growing in Senegal. The Copernicus Global Land Cover dataset aligned significantly better with the observed distribution of smallholder plots. The lesson generalises: global land cover products should always be validated against local ground truth before use in agricultural AI, not assumed to be accurate.
What does SARIMA add over a simple regression model?
SARIMA is a seasonal autoregressive integrated moving average model that explicitly captures the seasonal and trend components of a time series, making it well-suited to NDVI data, which follows predictable annual cycles aligned with growing seasons. A simple regression on a single NDVI value cannot capture temporal patterns or produce a forward forecast. SARIMA generates a full NDVI trajectory forecast for the remainder of the season, which then feeds a yield regression model — enabling in-season predictions before harvest data is available.
Why did the 2019 Sorghum forecast fail?
Sorghum yields in 2019 were anomalously high across multiple Senegalese regions. The SARIMA model was trained on data from 2016 to 2018, which did not include a comparably high-yield year. Without exposure to such anomalies during training, the model defaulted to predictions within the historical range, missing the 2019 spike. This is a known limitation of all time-series forecasting in agricultural settings: anomalous climate years can only be predicted if the training history contains comparable anomalies.
How quickly could this pipeline be replicated for another West African country?
For the SARIMA time-series pipeline, the primary requirement is regional NDVI data from ASAP and regional yield data from an equivalent source. ASAP covers all of Africa, so data acquisition is straightforward, and the yield regression model can be retrained in hours. For the CNN-LSTM pipeline, the bottleneck is the ground-truth yield data: if comparable records exist from a climatically similar country, transfer learning can significantly accelerate the process. A new country with adequate data could be onboarded in weeks rather than months.
Share this article
Share on LinkedIn, send by email, or copy the direct link.