
Using Unsupervised Learning on Satellite Images to Identify Climate Anomalies
Machine Learning and unsupervised learning for capturing sudden climate change after natural disasters in Somalia to provide immediate relief actions.

April 30, 2020
7 minutes read

This work is a part of Omdena’s AI project with the United Nations High Commissioner for Refugees. The objective was to predict forced displacements and violent conflicts as a result of climate change and natural disasters in Somalia.
Using unsupervised learning techniques on satellite images for capturing sudden environmental changes (after-effects of natural disasters or conflicts) to provide immediate relief to people affected. The solution functions as an alert system.
The problem
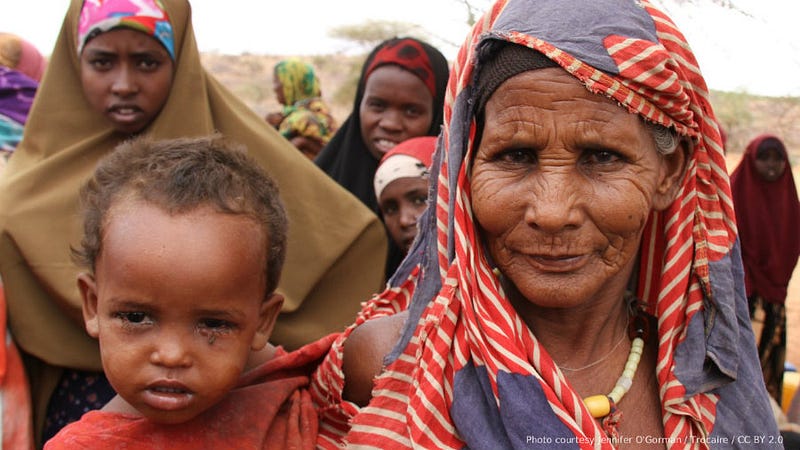
Somalia is a small country in the continent of Africa. The country exhibits a lot of natural disasters and terrorism as a result of which people of Somalia go through mass displacements leading towards a situation of lack of food and shelter.
This article shows how to build an anomaly detection system using Machine Learning. The system is capable of capturing sudden vegetation changes, which can be used as an alert mechanism to provide immediate relief to the people and communities in need.
What is Anomaly Detection?
Anomaly Detection System using satellite images is an area where a lot of research is happening to discover new and better methods.
We approached the problem using unsupervised learning technique i.e using Principal Component Analysis and K-Means. In the case of anomaly detection, unsupervised learning will take multi-temporal images to find changes in the images. Finally, the output map will have highlighted regions of change that could be used to send an alert to representatives at UNHCR if any major deviation occurs between two continuous temporal images.
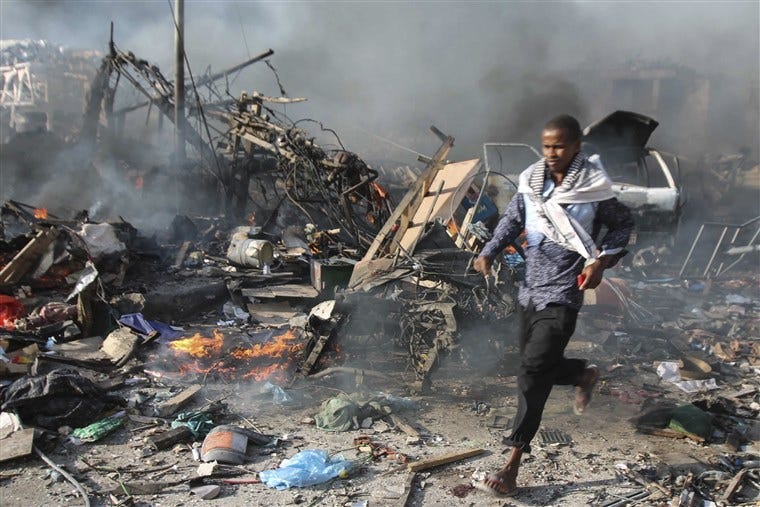
Fig 2: In 2017 Bomb Attack in Mogadishu (Somalia) Kills 276
The approach
First try: Convolutional Neural Networks
The first approach that I came up with was to use deep learning techniques, namely CNN+LSTM, where CNN could help extract relevant features from the images and LSTM could help to learn the sequential changes. This way our model could learn the changes that occur gradually and if any major changes such as natural disaster or conflict occurred in that area, the predicted value of our model and actual value would have the difference much greater than the normal value. This would signify that something major has happened to send an alert UNHCR.
As often in the real world, there was not enough data to apply deep learning Therefore we looked for an alternative.
The solution: Less shiny algorithms
The problem of anomaly detection could be solved with both supervised and unsupervised learning techniques. Since the data was not labeled we went with unsupervised learning techniques. Change detection can be solved using NDVI values, PCA analysis, Image difference methods, etc.
We went through some great methods for anomaly detection including a split based approach to unsupervised learning detection[1]. Comparing two images of the same geographical area at two different times pixel by pixel and then using some algorithms like thresholding algorithms, Bayes theory to generate change map[2]. After doing some research I finally went with the PCA + K-means technique [3] as some previous methods were either taking a lot of assumptions or were directly applied to raw data which could bring a lot of noise.
The data
For this project, we needed the satellite data of regions from Somalia. The images can be downloaded either from the earth explorer website or from Google Earth Engine API. You must ensure that the data downloaded has cloud coverage as minimal as possible. This is a common problem working with satellite images.
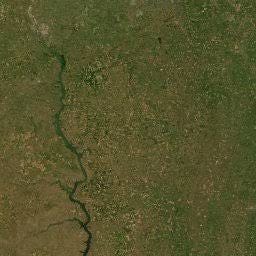
Fig 3: EarthExplorer Image
The solution: Unsupervised Learning
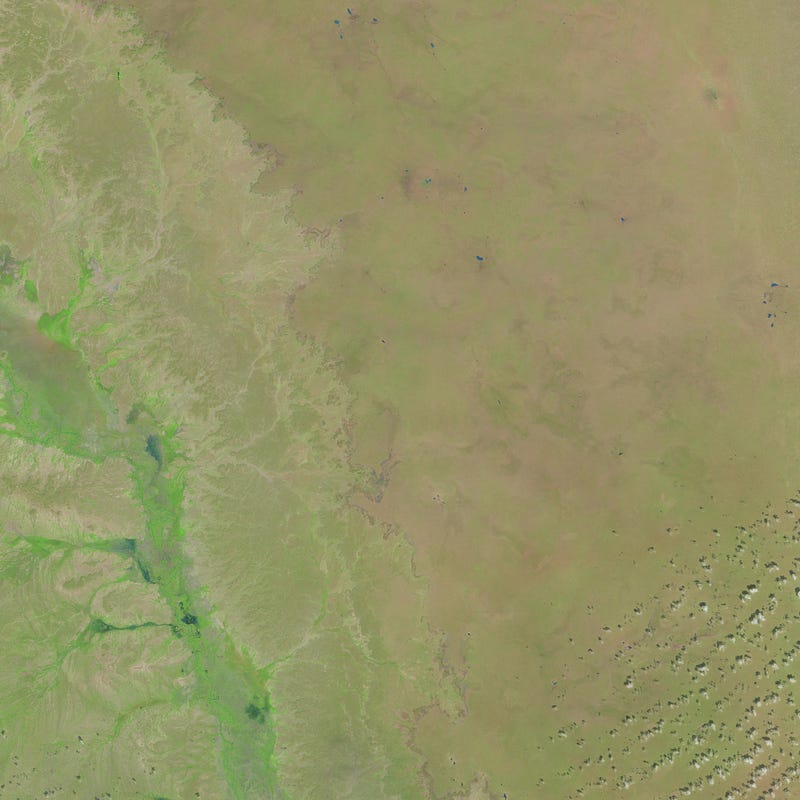
Fig 4: Satellite Image of an area from Somalia. Here you can see a lot of vegetation and greenery
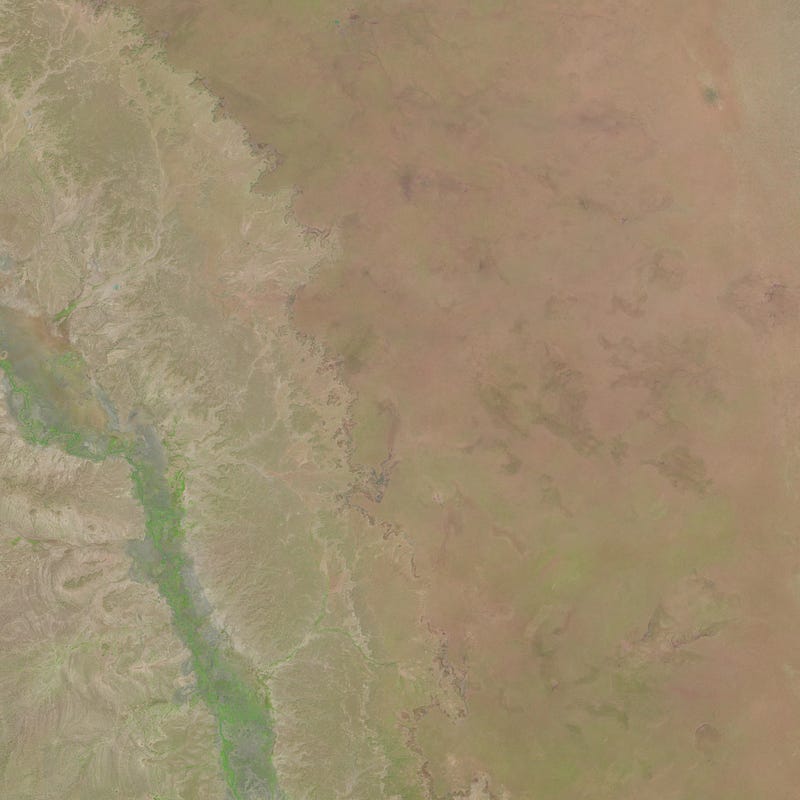
Fig 5: Satellite image of the same area at a different time. Here you can see that vegetation is less than in the previous image 4.
Calculating the difference between both images
Differences between the two greyscale images were calculated through pixel by pixel subtraction. The computed value will be such that the pixel of areas associated with the change will have a much larger difference than unchanged areas.
Xd = |X1 – X2| where Xd is the absolute difference of the two image intensities.
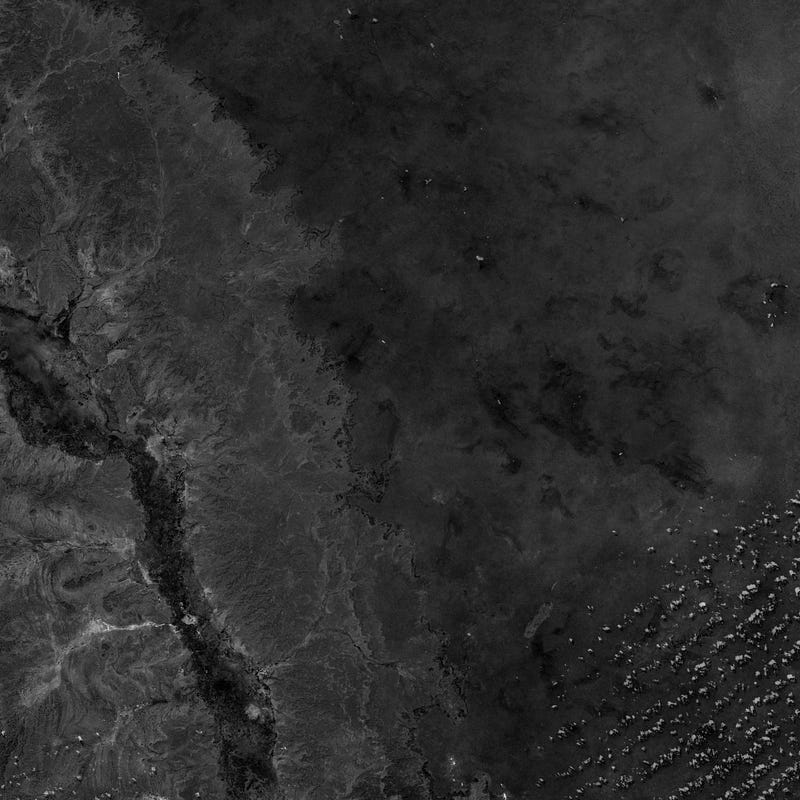
Fig 6: The difference image of the bi-temporal images shown earlier.
Principal Component Analysis
The next step was to create an eigenvector space using PCA. The first step is converting your image into h X h non-overlapping blocks where h can be anything greater than 2. Let’s call these sets of vectors Y. Principal Component Analysis is used to correct for decorrelation caused by atmospheric noise or striping. PCA drops the outline component from the bands and which then can be then used to classify.
Creating a feature vector space
The next step was to create a feature vector space. A feature vector space was constructed for each pixel of the difference image by projecting the neighborhood of each pixel on eigenvector space. This was done by creating a h X h overlapping blocks in the neighborhood of each pixel to maintain contextual information. Now we have a clean and high variance set of vectors that can be used for classification.
Clustering
This step involves generating two clusters based on feature vector space by applying K Means. The two clusters will be one that will represent change and others that will represent change. These feature vector already carries the information whether they carry changed pixel or unchanged one. When there is a change between two images in a region, the assumption is that the values of the difference vector over that region will be higher than in other regions. Therefore K Means will partition the data into two clusters based on the distance between cluster average mean and pixel vector. Finally, the change map was constructed with higher values of pixels over regions of change.
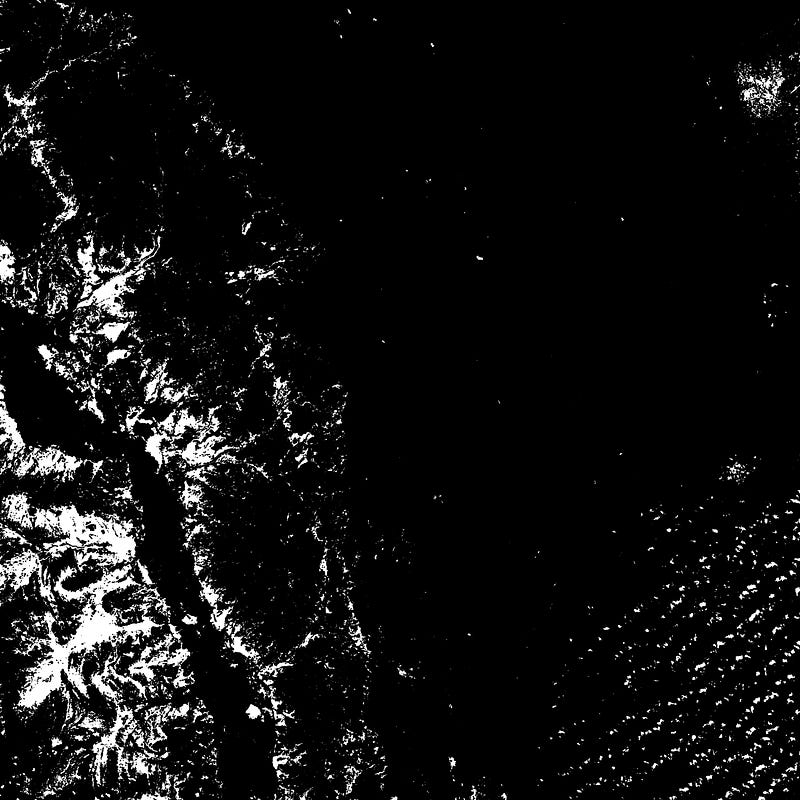
Fig 7: The highlighted part depicts the difference between the two images. The image is flooded with white spots because there was a lot of loss of vegetation in the two images.
The highlighted areas could be further used to examine the extent of change that occurred in a continuous sequence of time and therefore could help UNHCR take necessary actions. Loss of vegetation to such an extent like fig 7 would happen only when sudden large conflicts or natural disasters will occur and thus creating an alarm.
Conclusion
In this project, we were able to develop an anomaly detection model using PCA and K Means which could highlight areas of change. The highlighted areas could be further used to examine the extent of change that occurred in a continuous sequence of time and therefore could help UNHCR take necessary actions. Loss of vegetation to such an extent like fig 7 would happen only when sudden large conflicts or natural disasters will occur and thus creating an alarm.
Since cloud coverage is a common problem while working with satellite images (bottom left region of the image), human intervention is required. Hence there is an area of improvement.
This article is written by Animesh Seemendra.
You might also like


