
How To Estimate Possibly Undetected COVID-19 Infection Cases
Using a simple mathematical approach for estimating undetected Covid-19 cases and recommendations for governments to enhance testing facilities.

April 7, 2020
8 minutes read

Why estimating undetected Covid-19 cases is crucial?
An estimation of the undetected Covid-19 cases is important for authorities to plan economical policies, make decisions around different stages of lockdown, and to work towards the production of intensive care units.
How far is a Covid-19 testing center from your home? (credit: link)
As we have crossed a psychological mark of 1 million Covid-19 patients around the globe, more questions are popping up regarding the capabilities of our health care systems to contain the virus. One of the major worries is the systematic uncertainty in the number of citizens who have hosted the virus. The major contribution to this uncertainty is possibly due to the small fraction of Covid-19 tests being performed.
The main test to confirm if someone has Covid-19, is to look for signs of the virus’s genetic material in the swab of their nose or throat. This is not yet available for most people. The healthcare workers are morally restricted to reserve the testing apparatus for seriously ill patients in the hospital.
In this article, I will show a simple Bayesian approach to estimate the undetected Covid-19 cases. The Bayes theorem can be written as:
P(A|B) = P(B|A) × P(A) / P(B)
where P(A) is the probability of event A, P(B) is the probability of event B, P(A|B) is the probability of observing event A if B is true, and P(B|A) is the probability of observing event B if A is true.
The quantity of interest for us is P(infected|notTested) i.e. the probability of infections that are not tested. This is equivalent to the percentage of the population infected by Covid-19 but not tested and we can write it as:
P(infected|notTested) = P(undetected|infected)×P(infected)/P(notTested)
Here the other probabilities are:
- P(notTested|infected): Probability of tests not done on people that are infected or percentage of the population not tested but infected.
- P(infected): Prior probability of infection or known percentage of the infected population.
- P(notTested): Probability or percentage of people not tested.
The following plot shows the total Covid-19 tests per million people and the total number of confirmed cases per million people for several countries. This suggests a clear relation between the Covid-19 tests and confirmed positive detections.
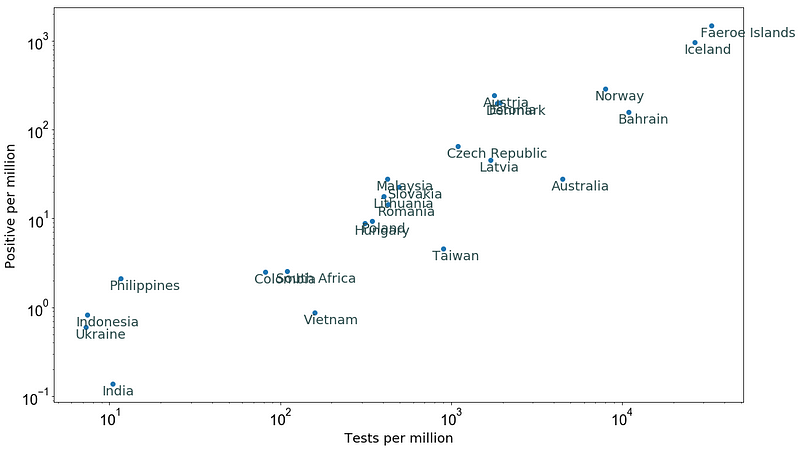
Figure 1: Tests per million versus positive Covid-19 cases per million as of 20 March 2020 (data source).
Assuming that all countries follow this relation between the Covid-19 tests and confirmed cases, we can make a rough estimate of the number of undetected cases in each country (I will come back to this assumption later in this post).
Let’s take Australia as an example:
For example, the plot shows that prior knowledge of infected cases
P(infected) = 27.8/10⁶, and
P(notTested) = (10⁶ — 473)/10⁶.
To estimate the P(notTested|infected), I used the relation between the Covid-19 tests and confirmed cases as in the above Figure 1. This is done by fitting a power law of the form: y = a * x**b, where a is normalization and b is the slope of this power law. The following plot shows a fit to the data points from the above plot, where the best fit a = 0.060±0.008 and b = 0.966±0.014.
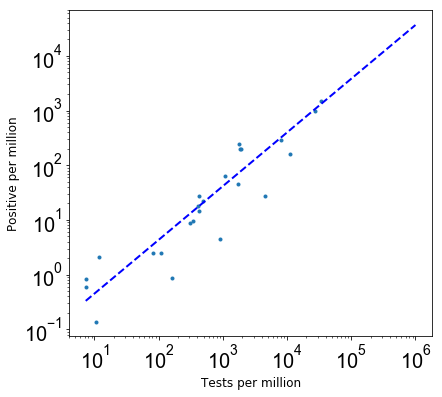
Figure 2: The relation between Covid-19 tests and confirmed cases and a power-law best fit.
Using the best fit parameters, P(notTested|infected) = (10⁶— 4473)/10⁶ / (a * (10⁶ — 4473)**b)/10⁶.
With probabilities 1, 2 and 3, I find P(infected|notTested) = 0.00073 per cent population of Australia. Multiplying this by the population of Australia indicates that there is a possibility of about 18,600 undetected Covid-19 cases in Australia. The following plot shows possible undetected Covid-19 cases as a function of tests per million for different countries as of 20 March 2020.
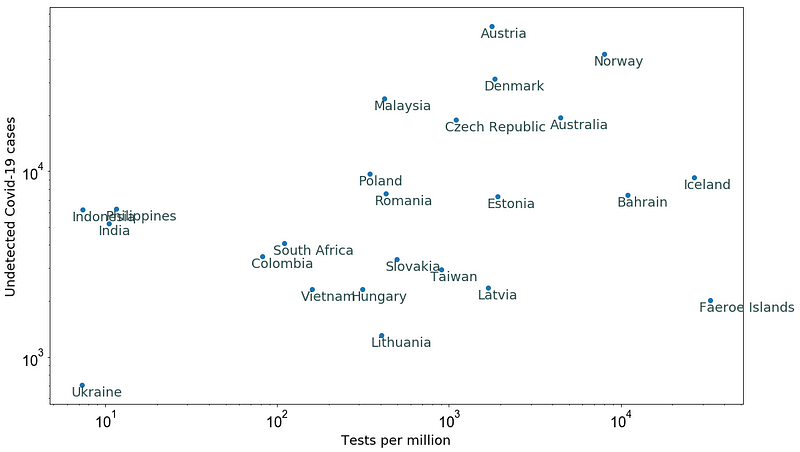
Figure 3: Estimation of undetected Covid-19 cases (see assumptions in the text).
Note that several assumptions and considerations are made to estimate these undetected cases. For instance:
- I assumed that all countries would follow the same power-law relation to estimate P(notTested|infected). However, this is not an extremely good assumption as there is huge scatter in this relation between different countries.
- Our prior knowledge of the number of infections can be biased itself as P(infected) depends on the number of tests performed as of 20 March 2020.
- I haven’t considered the susceptibility of a country’s populations to Covid-19, and the attack rate i.e. the biostatistical measure of the frequency of morbidity, which for Covid-19 is estimated around 50–80% (Verity et al. 2020).
- The impact of government policies of these countries from 14 days before 20 March and 14 days after is not considered.
- I haven’t considered how susceptible people are targeted for testing in different countries in the next days.
Figure 4 below shows the total number of confirmed cases versus the tests per million as of 5 April 2020 for several countries (data source).
After 16 days on 5 April, the confirmed positive cases in countries like Ukraine, India and Philipines are consistent with the predictions in Figure 3. These countries performed ≤ 10 tests per million people as of 20 March.
Note that the consistency between estimations as of 20 March and 5 April does not necessarily mean that all undetected cases as of 20 March are confirmed now. Several of the confirmed cases as of 5 April are expected to be new cases due to the spread between 20 March and 5 April (even in the presence of lockdowns).
The estimated undetected cases for countries like Colombia and South Africa are about twice as large (Figure 3) as compared to the total confirmed cases as of 5 April (i.e. about 1,500 for both). Both countries have performed about 100 tests per million people.
Countries like Taiwan, Australia, and Iceland, on the other hand, have shown an order of magnitude small number of confirmed cases as compared to estimated numbers in Figure 3.
This indicates that the countries that have not boosted their testing efficiency to more than 1,000 tests per million people have significantly larger uncertainties on the number of current confirmed cases.
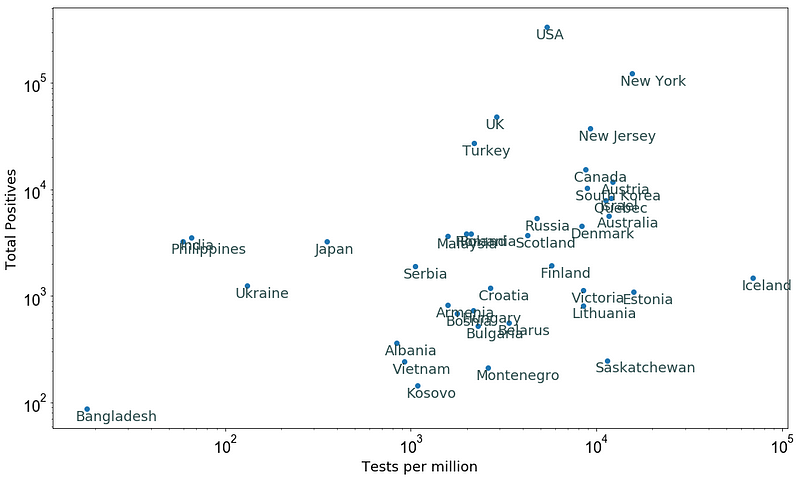
Figure 4: The total number of confirmed cases versus the tests per million as of 5 April 2020.
Given the data in Figure 4 from 5 April 2020, I repeated the whole exercise again to estimate the undetected Covid-19 cases for these countries, cities, and states. The following figure shows the best fit power-law and data points similar to Figure 2 but for the data as of 5 April 2020.
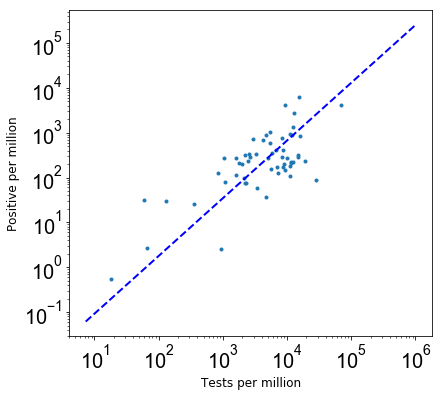
Figure 5: Best fit power law for data as of 5 April 2020.
The best-fit slope for the power-law relation in Figure 5 (b = 1.281±0.009) is consistent with the slope in Figure 2 at 2-σ confidence level. This helps our assumption of estimating P(notTested|infected) from the best fit power-law relation (the slope is not changing), however, other caveats are the same as before.
Finally, the following plot shows the estimated undetected Covid-19 cases for different countries as of 5 April 2020.
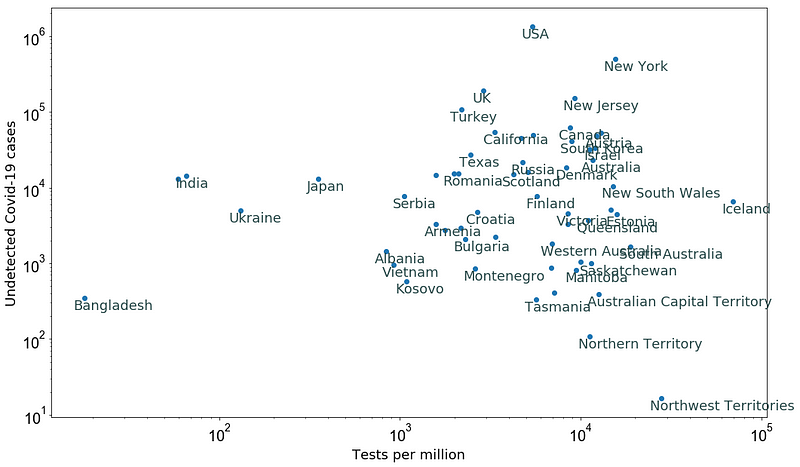
Figure 6: Estimated Undetected Covid-19 cases as of 5 April 2020 (see assumptions in the text).
As the comparison between the undetected estimations as of 20 March (Figure 3) and confirmed cases as of 5 April (Figure 4) shows that more tests per million people are required to capture the possible undetected cases, thus now is the high time that authorities raise the testing efficiency in order to reduce the systematics from undetected Covid-19 cases. This seems to be the only good way to reduce the death rate of Covid-19 patients as indicated by the large amount of Covid-19 testing in Germany and South Korea.
To make this happen, all countries need at least one testing center within a radius of 20 Km and arrange more drive through testing facilities as soon as possible.
This work was done in collaboration with the people working on the Omdena Coronavirus AI challenge.
You can contact me on LinkedIn and follow my academic research on Orcid.
How Omdena is combating the Coronavirus
A good start to learn more about Omdena’s innovation platform is to read about our Coronavirus Policy AI Challenge, where more than 70 AI and domain experts are collaborating to build AI models that reveal the direct and indirect impact of pandemic policies on the economic health of marginalized communities.
Our aim is to support policymakers in identifying the most effective ways to minimize the economic suffering of those most vulnerable.


