Domestic Violence - The Shadow Pandemic of COVID-19
Significant correlations between lockdowns and domestic violence found using news articles, policy data, mobility trends, and search rates during COVID-19.

May 27, 2020
13 minutes read

The Problem: Effects of policy measures on the vulnerable population
To prevent the spread of Covid-19, many governments have been taking strict measures such as closing borders, imposing nationwide lockdowns, and setting up quarantine facilities. While these measures may ensure that social distancing is followed seriously, they may have indirect effects on the economy and adverse effects on the well-being of people, especially the vulnerable population. To help governments make data analysis-driven policy decisions to effectively deal with issues like during COVID-19 like Domestic Violence, Omdena provided an enabling platform to AI experts, data scientists, and domain experts so that they could study the effects of Covid 19 policy measures on the vulnerable population. This article describes the results of one of many facets of this challenge, which focused on the impact of Covid-19 on domestic violence using Data Analysis.
The goal of this task was to get a better grip on domestic violence during COVID-19 and gauge the scale of the problem. To this end, different data sources were used — including news articles, policy data, mobility trends, and domestic violence search rates. The results indicate that the problem of domestic violence could be much bigger than indicated by some of the key figures mentioned in the news. Further, restrictions on movement and strict enforcement of lockdowns may have further amplified the issue. It can be said that domestic violence is a shadow pandemic and it is integral to understand the gravity of the problem and ensure redressal and support to survivors and vulnerable populations.
Domestic violence — a growing shadow pandemic of COVID 19
The UN Women recently labeled the increase of violence against women as ‘a growing shadow pandemic’. As a consequence of Covid19 policy measures, many victims find themselves in proximity to their abusers due to lockdown measures. The world is witnessing a sharp rise in the number of helpline calls, domestic violence reports, as illustrated in the following infographic. This highlights the pressing need to reflect upon the pre-existing and growing incidence of domestic violence and sensitizing organizations and communities at the grassroots level to provide help and support.
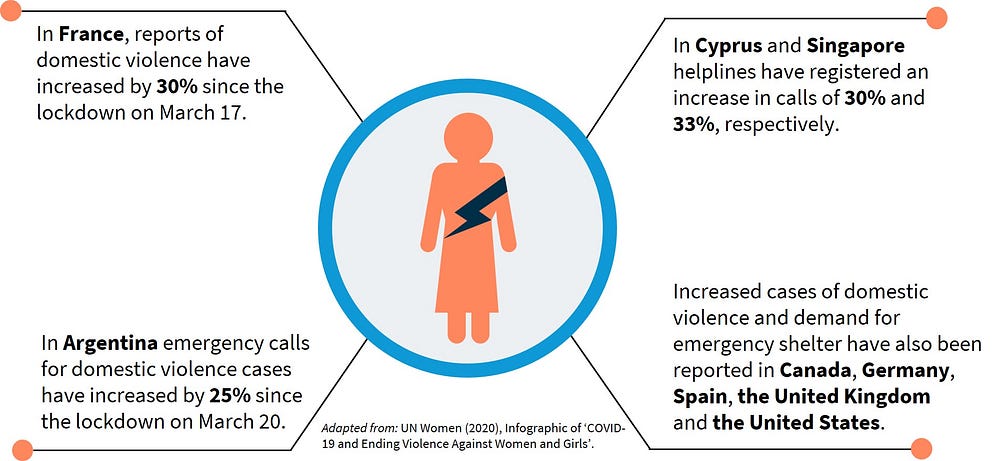
Infographic on Covid19 and domestic violence adapted from the UN Women.
The shadow pandemic’s size— news coverage
The news is replete with reports and cases of domestic violence and its surge during the pandemic. During March beginning, the increase in domestic violence in China received coverage in the news. In the Hubei Province the number of reported cases had tripled in February, compared to the same period last year. Weeks later, similar articles appeared from all over the world.
To get the first grip on gravity and spread of this shadow pandemic, a dataset of about 80,000 Covid-19-related news articles was used. This dataset was created using GDELT to query relevant articles and news-please to extract contents. The said dataset has been used for different analysis in the Omdena AI pandemic challenges. To identify the news articles related to domestic violence, the corpus was filtered based on domestic violence-related keywords. In total 1,500 articles were linked to both Covid-19 and domestic violence using Data Analysis revealing a connection.
Covid19 and domestic violence-related articles
To assess the relevance of the subset of domestic violence-related news articles, LDA topic modeling was performed, using gensim. Three topics were modeled, and one of these clearly illustrates that the considered subset covers domestic violence. The world-cloud of this topic is shown in the figure.
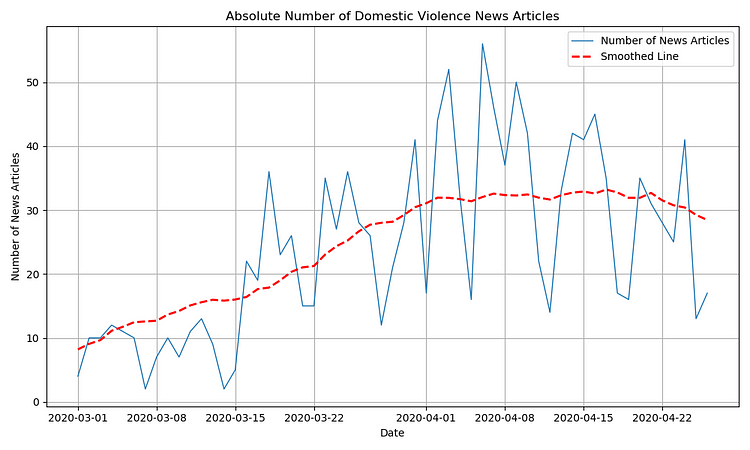
Number of both Covid19 and domestic violence-related news articles over time.
The absolute increase in domestic violence-related articles
The number of news articles related to both Covid-19 and domestic violence started to increase a couple of weeks after the first lockdown measures were implemented in Europe (end of February).
Relative increase
The increasing trend in domestic violence-related articles could be explained by an overall increase in Covid-19 related articles. To study whether the topic of domestic violence has become more dominant in the discussion, the ratio of domestic violence-related articles versus the total number of Covid-19 related articles is illustrated. An increasing trend can be observed using Data Analysis, indicating that the issue of domestic violence has become more dominant post the onset of the pandemic.
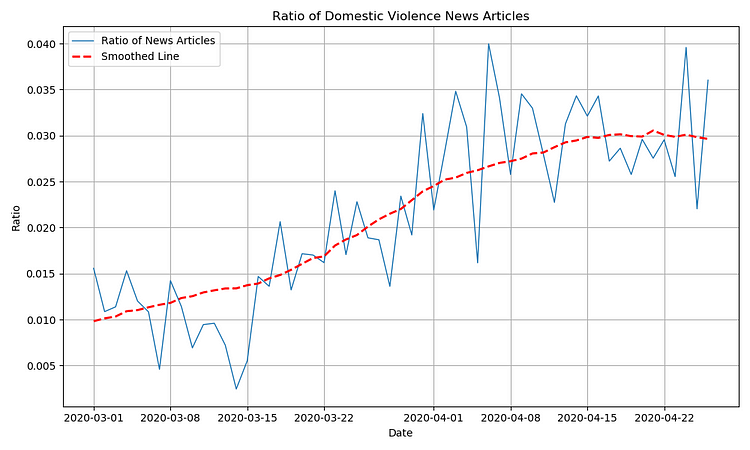
Domestic violence-related news articles are relative to Covid19 related news articles.
The shadow pandemic’s size — search rates
The data mentioned in the news is typically in summary form, similar to the key figures shown in the Infographic of UN Women. To get a more detailed grip on the extent and size of the shadow pandemic, different datasets were used:
- Policy data:
OXFORD COVID-19 Government Response Tracker (OxCGRT), covers the policy measures taken in 152 countries (accessed on May 8, 2020). - Mobility data:
Google COVID-19 Community Mobility Reports, indicate the percentual changes in mobility patterns in 132 countries (accessed on May 8, 2020). The data is relative (_rel) to the mobility patterns between January 7 and February 7, 2020. To limit stochasticity, a moving average (_ma) filter of 7 days (1 week) was applied. - Search data:
Google Trends data, indicates the search trend of a certain topic over time (accessed on May 8, 2020). To get the percentual change (_rel) in search rates, this date is made relative to a baseline period as well (Jan 3 — Feb 13). To remove stochasticity a moving average filter (_ma) of 14 days (2 weeks) was applied to the Google Trends data.
The data analysis focuses on countries that are present in all three datasets, and that have sufficient Google Trends data available. The condition of having data available for at least 50% of the considered time period (Jan 3 — May 8) was imposed. This ensured that the analysis was expansive and included a total number of 53 countries.
The search trend data is considered to be relevant for studying the scale of the problem in situations where one is in search of help, has access to the internet, and has a certain level of trust in societal organizations to be able to offer help. Evidently, the last two conditions are not met in different countries to the desired level across the world. This is, amongst others, reflected in the Human Development Data — for example, the % of the (female) population that has access to the internet. Hence, the results should be considered with these conditions, caveats, and nuances in mind.
Further, the use of search rates has a clear advantage. The victim’s quest for help and receiving help is expected to consist of several steps; and more courage is required for every succeeding step that needs to be taken. The most basic step might be to browse the web for ways to deal with and seek help for domestic violence. Hence, search rate data might reflect the scale of the real problem more accurately than the number of domestic violence reports, because the search rate is probably the first step a victim might take in seeking assistance.
Correlation between policy measures, mobility, and domestic violence search rates using Data Analysis
The first step in the analysis is to study correlations between the different features in the dataset. The correlation plot for France is shown below. A highly negative correlation (-0.95) between workplace mobility and domestic violence search rates can be observed. And, as expected, workplace mobility highly correlates with the workplace closing policy measure that was implemented by the government.
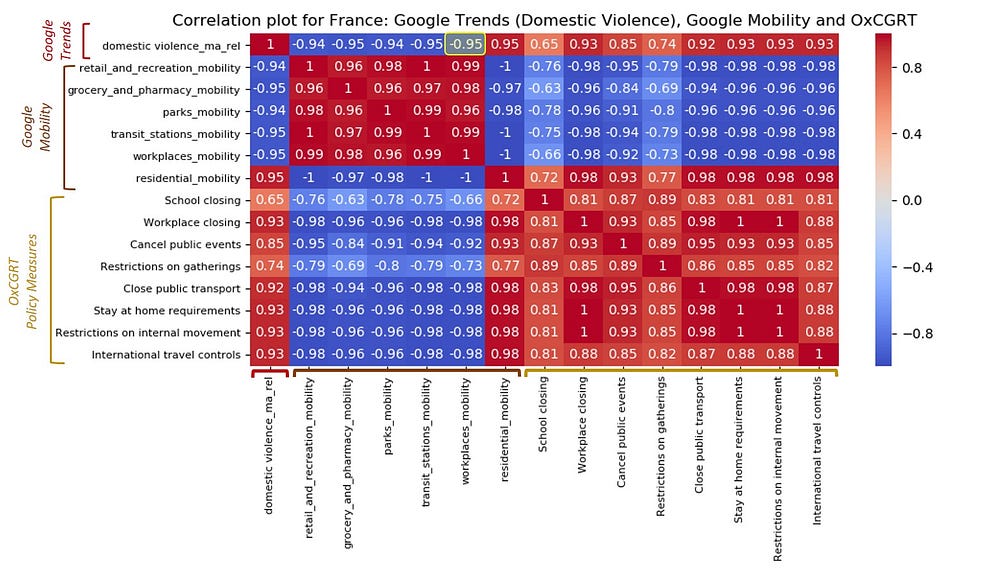
Correlation plot of the different features of the policy, mobility, and search rate dataset (France).
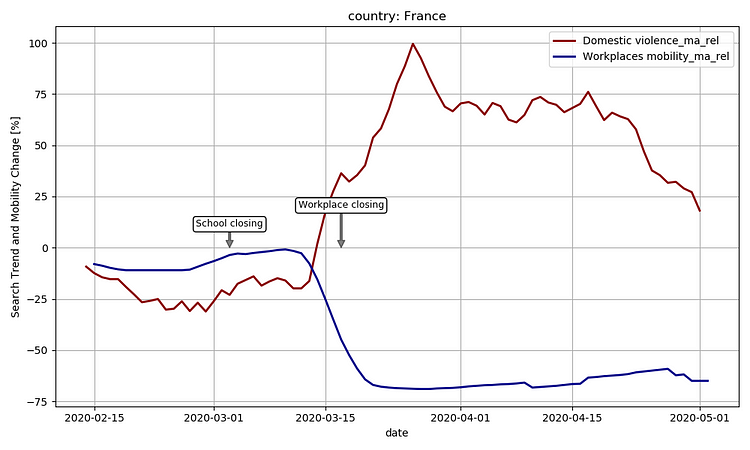
Policy measures, mobility, and search rate trends over time (France).
In the figure, the trend of workplace mobility and domestic violence search rates is visualized over time. The negative correlation between both variables is illustrated by the decrease in workplace mobility, while at the same time there is an increase in domestic violence search rates. Compared to the baseline, search rates almost doubled (100% increase). This indicates that the incidence of searching for information related to domestic violence increased with the decline in workplace mobility and as people found themselves stuck at home.
Regression models to quantify the effect of mobility on domestic violence search rates
Regression models were used to assess the size and significance of the relationship between workplace mobility and domestic violence search rates.
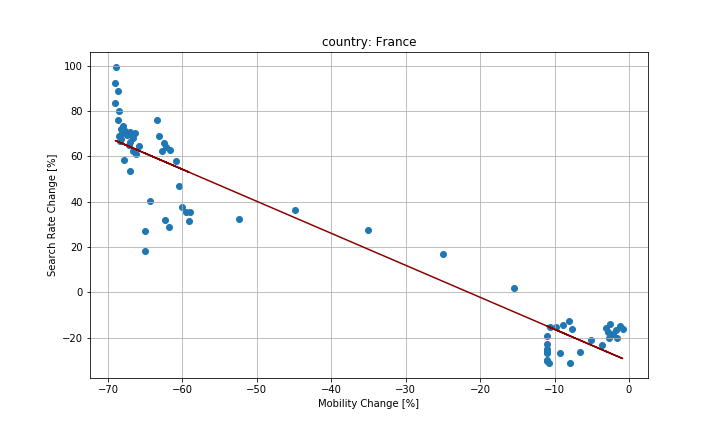
Regression model results of the impact of mobility on domestic violence search rates (France).
The linear line in the scatter plot is the illustration of the output of the regression model for the case study of France. The relationship between mobility and domestic violence is significant, and the slope indicates that with every 1% decrease in mobility, domestic violence search rates increase by 1.4%.
The results of the models for the countries in the top 10 and bottom 10 are listed below. In the top 10 countries, decreasing mobility correlates with a steep increase in domestic violence search rates. In the bottom 10 countries, the opposite trend is observed: mobility and domestic violence both decrease at the same time. To further study and explain the results of the different models, the individual plots for the first six in the categories of the top 10 and bottom 10 countries are shown in the next section.
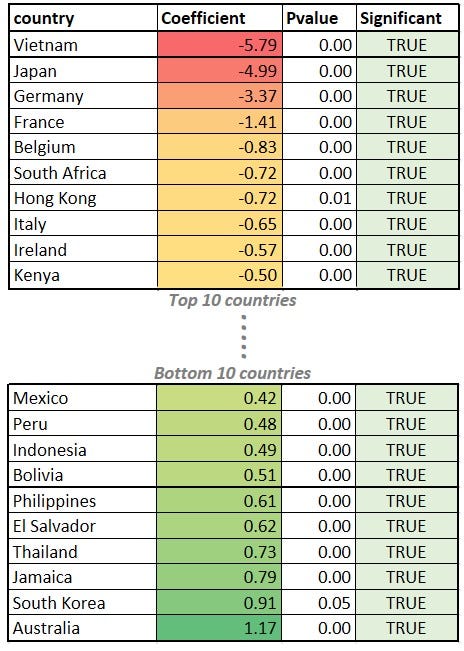
Countries illustrating a strong relationship between a decrease in mobility and an increase in domestic violence
The individual figures for the first six among the top 10 countries are shown. These countries have a strong relationship between mobility decrease and domestic violence increase.
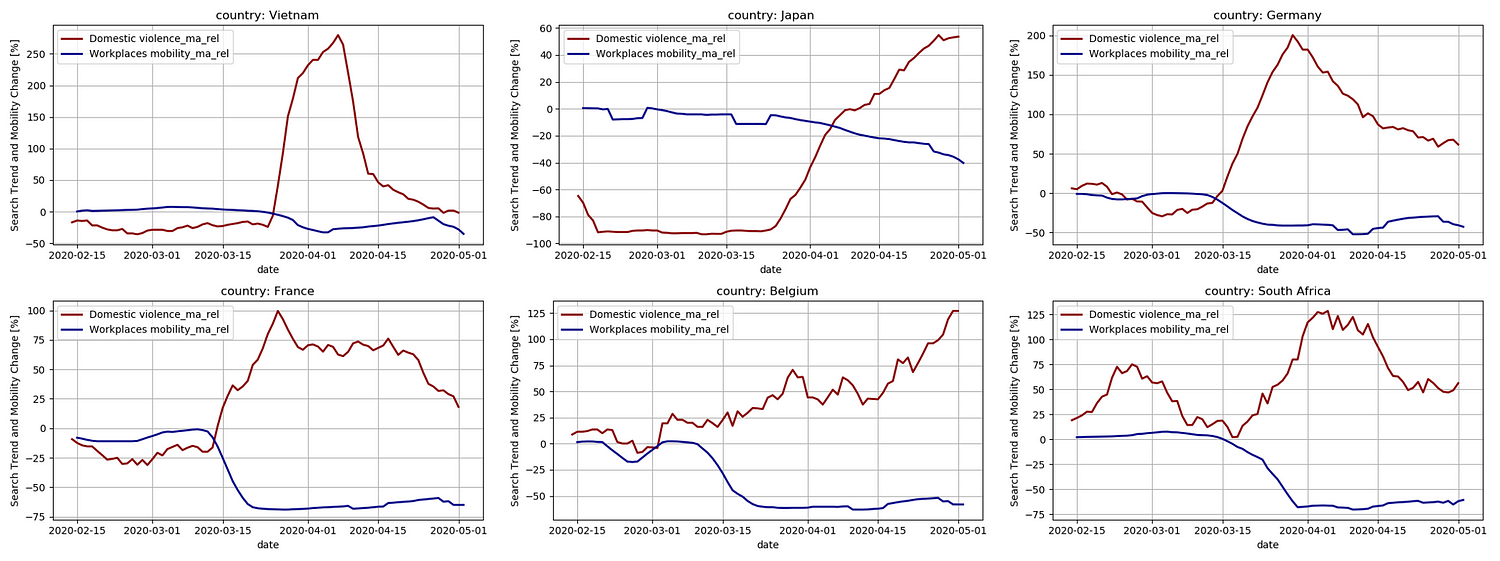
- With the exception of Japan, the peak in search rates has doubled or even tripled in each of the illustrated countries.
- Although the coefficient in Japan is relatively high, the peak in search rate is ‘just’ 60%. This is due to a relatively limited decrease in mobility, likely due to less strict lockdown measures in this country.
- Vietnam stands out with a peak in domestic violence search rates that increased by more than triple the baseline. The issue of domestic violence in light of social distancing in Vietnam is stressed in this article as well, stating that the number of people who are in need of shelter has doubled compared to 2018 and 2019.
- The figures for Germany, France, Belgium, and South Africa, clearly illustrate the increasing trend in domestic violence search rate as mobility drops.
Countries not illustrating a relationship between a decrease in mobility and an increase in domestic violence
The individual figures for the final six countries among the bottom 10 countries are displayed below and show a positive relationship between mobility and domestic violence.
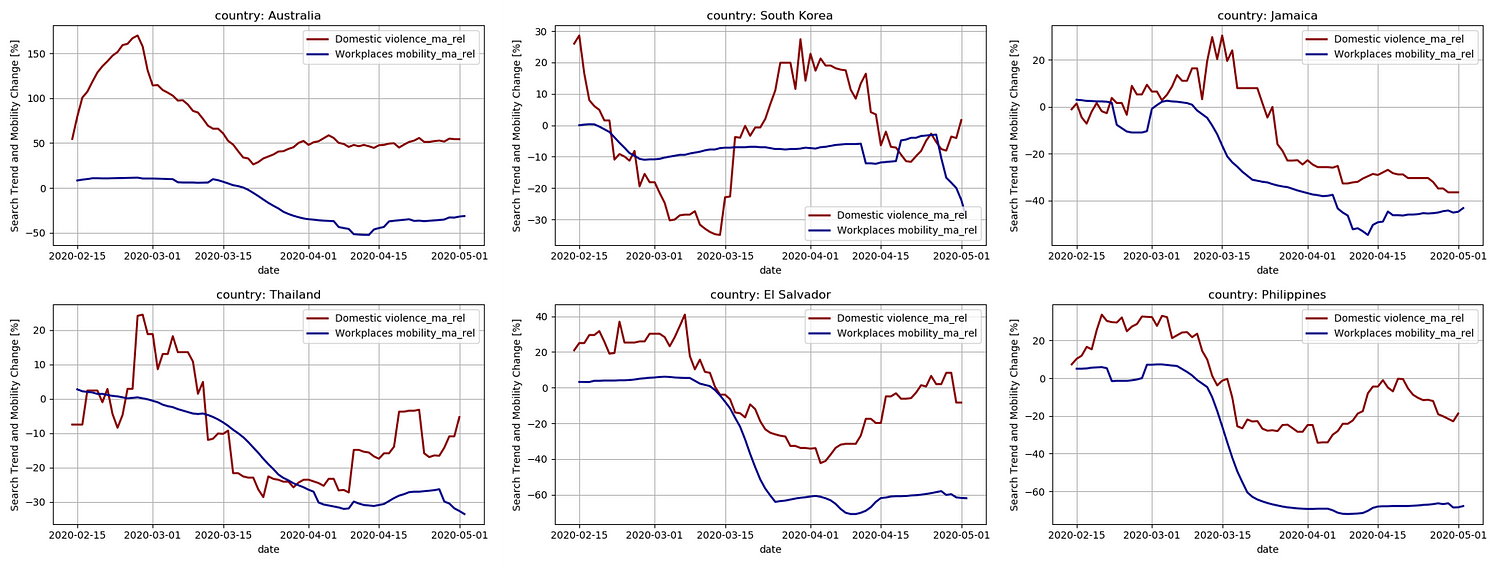
- First of all, the plot for Australia stands out, which witnessed a high increase in domestic violence towards the end of February. The sudden rise in domestic violence in Australia is assumed to be a consequence of the bushfires which occurred around this time. This relationship is also expressed in this article: ‘the bushfires’ hidden aftermath: Surging risk of domestic abuse’
- In South Korea, lockdown measures could be considered to be more targeted instead of strict blanket measures, and this could explain the unique trend displayed for this country as compared to the others.
- For the Philippines, Thailand, El Salvador, and Jamaica, the simultaneous drop in domestic violence search rates and mobility is visible. This does not mean that there have been fewer domestic violence incidents. There can be various other factors influencing the observed search rate trends. For example, the peaks in search rates in these countries towards the late February / beginning of March could be explained by the (media) attention given to domestic violence in light of International Women’s Day on March 8. there was a large turnout for the different marches that were held that day, both in Asia and Latin America.
Action is needed to mitigate the increase in domestic violence
This article studies the impact of the Covid-19 global pandemic on domestic violence. The increase in domestic violence can be viewed as the ‘growing shadow pandemic’. This is stressed by the news as well — there is an increasing trend in the number of articles that cover the issue. Some of these articles give insight into the gravity and scale of the ‘growing shadow pandemic’ in summary form. For example, the Infographic of UN Women, shown at the beginning of this article, mentions that in France, Argentina, Cyprus and Singapore domestic violence emergency calls and reports have increased by more than 30%.
The results indicate that the problem of domestic violence could be much bigger than indicated by some of the key figures in the news
The Data analysis of Google mobility and search rate trends shows that the effect of lockdown measures on domestic violence, such as the closing of workplaces, can be much higher than 30%. In countries where the inverse relationship between the decrease in mobility and increase in domestic violence is strongest, search rates have doubled, and some more than tripled. A search query could be considered the most accessible step in seeking out help. This could explain why the results in this article indicate that the problem of domestic violence could be much bigger than the previously mentioned key figures.
It is important to note that there are many other factors that can influence the search rate results. The extent to which the search rates may accurately reflect the growing scale of the problem of domestic violence also depends on the situation the countries are in. As stated before, a victim is only expected to perform a search query if s/he has access to the internet and a certain level of trust in societal organizations to be able to offer help. These assumptions could explain that a strong relationship is found in many European countries in this study.
The aim of this work is to help build awareness on the issue of domestic violence. Although some countries have adopted steps to mitigate problems, the results clearly indicate that the issues persist. In this light, the UN recently published a brief with ‘recommendations to be considered by all sectors of society, from governments to international organizations and to civil society organizations in order to prevent and respond to violence against women and girls, at the onset, during, and after the public health crisis with examples of actions already taken’.
This article is written by Elke Klaassen.


