
Finding Answers to the Student Debt Crisis Through Data Science
August 5, 2020

As one of the task leaders, I am going to walk you through the steps we took in solving this challenge. It is less about the data and results, more about what you do with them.
Step 1. Setting the scope
Is there anything about student debt that we do not know about?
Omdena’s method of branching out into different task groups allows the freedom to cover many sides of a problem. The content of the task brings a team together — an idea is proposed and then voted into a task, with team members joining in, setting the agenda, and collectively taking decisions. As somebody with years of experience in the Higher Education (HE) sector in the UK, I felt that I am familiar with the subject matter and proposed the scope of our task to be the impact of Student Debt Crisis on different demographic groups (namely: female students, ethnic minority students, and first-generation students) and finding an AI solution for this student debt crisis. I chose this for the following reasons:
- The gap in participation and attainment between ethnic minority groups and the rest is a well-documented problem, and recent events have made it even more relevant.
- In the UK and elsewhere, there are questions about the necessity of taking up debt and the value of having a degree.
- There is evidence that student debt disproportionately affects certain demographic groups, disadvantaging the very groups that higher education was supposed to benefit the most.
- All of the above, if unaddressed, may lead to a drop in participation of disadvantaged groups in HE, reversing years of progress.
So we set our task goal to explore how student debt affects the different demographic groups, why, and what can be done about it through the multitude of data available.
Step 2. Setting the methodology
Keep it simple.
Being a community of ML and AI practitioners, the suggestions that came were regarding modeling, clustering sentiment analysis, web scraping, but there were also voices for the more traditional data analysis for this Student Debt Crisis Challenge. We ended up choosing the latter because:
- Such an analysis would allow us to compare different groups, which was the aim of our task.
- When applying machine learning approaches, it is easy to miss out on the detail. The volume of data hides the fact that there are different forces pulling in different directions.
- Higher Education is a regulated sector and there is a large volume of data from multiple sources.
- Our data is not coming from a single source, and not all of it is on an individual level, which makes modeling difficult.
Step 3. Getting to know the problem
Mapping the Student Debt Crisis journey.
With so many pieces of data, there is a danger of ending up with a collection of separate pieces of data, each one interesting in itself, but disjointed.
Having a framework beforehand would allow us to focus when researching sources, and also overcome one of the problems often found when applying machine learning –the ‘now what’ moment, when we see the data but cannot say what it means.
So, we created a map of the student loan journey, along with the questions whose answers we are aiming to find in data.
- Loan decision: Why do students have to borrow?
- Loan dimensions — How much are they borrowing and what are they getting for their loan?
- Loan and studying — What happens at the different study milestones?
- Loan and employment — What employment and earnings can be expected?
- Loan effects — Effect on mental health and HE value perception
To answer all these questions, we sought data for different demographic groups, as per our task goal.
Step 4. Getting the data.
Aim for variety.
Luckily, as is the case with other regulated sectors, there was no lack of data. The mixture of statutory, financial, survey, trend, and official stats data, apart from allowing us to cross-validate findings, allowed us to build a rich, multifaceted picture. At one point we had nearly 50 pieces of data in our shortlist to investigate — a challenging task even in itself. Some sources, like the College Scorecard dataset, were massive, and we had to apply a fair amount of manipulation and standardization. Some of the sources came with long definition lists, which took a while to unpick. The agile nature of the project allowed us to sneak in some data on the impact of COVID-19 at the last minute, making it even more relevant.
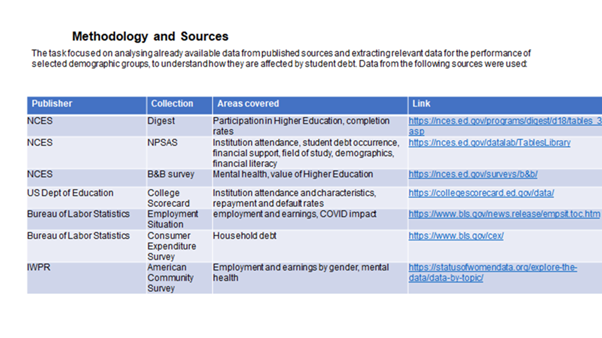
Datasets used for analysis
Step 5. The recommendations
The last mile
I am going through these steps together. Often analysis relies on data speaking for itself and falls short of interpreting and giving recommendations. However, having a framework from the beginning, breaking down the big questions into small ones, and linking the questions to data, we can see areas that can be acted upon.
For example, there is no silver bullet for tackling drop-out, but small steps can be taken, to challenge institutions about the completion gap between the different demographic groups, to facilitate non-punishing transfers, to set work/study standards, and to use AI and predictive analytics in order to improve degree completion during this Student Debt Crisis.
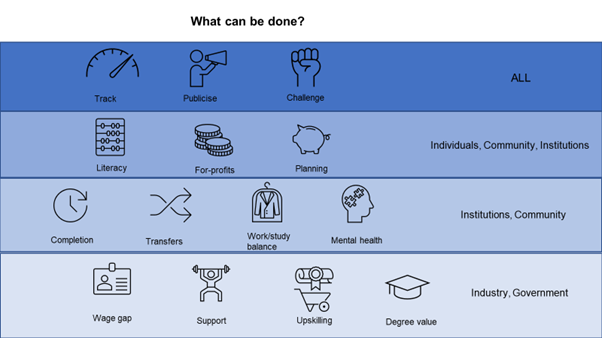
What can be done?
1. Why do students have to borrow?
Some of the answers:
- Low income and first-generation students are more likely to come from ethnic minorities
- Independent students are more likely to be black than dependent students
- Private for-profit institutions have a higher share of ethnic minorities, female and first-generation students
- Undergraduates from ethnic minorities tend to have lower financial literacy
In a nutshell: Ethnic minority students borrow more because they cannot rely on their families, they opt for more expensive institutions, and, because of lower financial literacy, may end up borrowing at disadvantageous terms.
What can be done about it?
Increase general financial literacy, encourage planning in advance, establish peer advice network.
2. How much are they borrowing and what are they getting their loan for?
Some of the answers:
- Minority ethnicity students more likely to be in debt, and have higher levels of debt.
- Minority ethnicity students are more likely to attend two-year institutions (Hispanic students tend to favor associate degrees) and multiple institutions.
- Private for-profit institutions have a higher share of ethnic minorities, female and first-generation students.
- Female, black and Hispanic students miss out on STEM subjects.
- African American households have the highest percentage of unpaid student loans.
In short: Having higher levels of debt does not necessarily translate into studying attractive subjects or landing at well-performing institutions.
What can be done about it?
Monitor and publicize institution data, advise on beneficial loan decisions, tackle the differences in STEM subject take-up.
3. What happens at the different study milestones?
Some of the answers:
- Private for-profit institutions, which tend to attract female, ethnic minority, and first-generation students, have low completion rates.
- Black students are relatively more likely to drop out or to transfer.
- One-third of black students are working over 20 hours a week while studying.
Summing up: Ethnic minority students are more likely to fall at the very first hurdle — that of degree completion, and having to work during study further jeopardizes their chances of completion.
What can be done about it?
Challenge institutions over retention rates and/or gap, deploy predictive analytics solutions to reduce dropout, advise cap on work hours, ensure financially fair transfers
4. What employment and earnings can be expected?
Some of the answers:
- Men are over-represented in STEM and business careers.
- Men’s earning for degree and advanced degree holders rise faster than women.
- For women with advanced degrees, the wage gap is wider.
- The share of associate degree holders is larger in the industries highly exposed due to COVID-19.
In short: The gender wage gap persists and is even more pronounced for advanced degree holders, which risks making entire industries short of women leaders. COVID-19 disproportionately affects holders of associate degrees, tend to be favored by Hispanic students.
What can be done about it?
Support women in STEM and be clear on employment reality for advanced degree holders. Use the corona-virus crisis to retrain and up-skill vulnerable groups, including associate degree holders.
5. What is the effect on mental health and the value perception of Higher Education?
Some of the answers:
- The majority of students from for-profit institutions and black students display high or very high levels of stress from education-related debt.
- Women report higher levels of ill mental health than men in all ethnicities.
- Degree holders from for-profit institutions are skeptical about their degree worth.
In summary: Students from for-profit institutions (mostly female, ethnic minority, and first-generation students) display higher degrees of stress and are clearly disillusioned by their higher education experience.
What can be done about it?
Make institution performance and loan conditions transparent, invest in debt counseling, emergency support, and relief, promote an unbiased view of the value of higher education and alternatives to a degree.
Conclusion
Even with a problem that has been addressed extensively, collective wisdom from an autonomous and diverse group can bring new insights. Contrary to the popular belief, lack of data was not the problem — it was scoping and breaking down the problem in the context of too much data, which is where collaboration and diverse thinking really helped. Yes, a self-organized international community presented challenges in agreeing times for meeting, brainstorming and feedback, but the colorful side of collaboration — the assorted and inconsistent graphs, as many styles as team members, was a welcome difference from the monotonous slide templates from our day jobs. In the end, there was a positive feeling that we have done our small bit to help to understand this big problem better and that it was a time well spent getting to know and learning from each other.
This article is written by Galina Naydenova.


