Using Machine Learning to Predict Student Debt Repayment Capability
A deep dive on recommendations for the current student debt crisis in the U.S. with more than 43 million students affected.

August 17, 2020
8 minutes read

Each day, there are news stories about the college tuition crisis. But what is the crisis we are seeking to solve? Is it the staggering amount of student debt? The rapidly rising cost of higher education? Is the interest being collected on student loans? The high default rate on student loans? Or all of the above?
At present student loan debt exceeds accumulated car loans and credit card debt by nearly $1.6 trillion. The student debt has hence become a $1.6 trillion crisis.
This case study highlights solutions to this problem using Artificial Intelligence (AI) and Machine Learning (ML).
- Using ML to predict the repayment capability of the students.
- Build a network that will allow the students to estimate the risk incurred while borrowing and manage the loan amount accordingly.
- Understand if the student’s future earnings are maximized by attending the best school they can get into, despite the cost incurred.
The task initially started with a lot of literature review that gave useful insights into multiple drivers for the current state of students in the US and how advances in ML and AI create new possibilities across markets. It enables new avenues to disrupt one of the most costly and impactful markets: that of student debt.
The findings were functional while segmenting the students and narrowing down the features to use for defining these segments.
Data preparation and feature engineering
After the initial literature review, we dived into the data preparation which involved collecting the right sources of data, EDA, normalization, and feature transformation. Multiple sources of data were used; College Scorecard Data, 2019 US student loan debt by location and age, and Trends in Graduate Student financing data by NCES.
Let’s look a little closer:
- Features with a large number of missing values were dropped.
- The data values were normalized given there were many different features.
Exploring the data further
The pre-processed dataset was huge so the next step was to select the relevant features from the insights gathered from the literature review. After having a round of Exploratory Data analysis and model simulations the following features were selected for further creating the segments using K-means clustering. IN order to handle missing values MICE imputation technique was used for 3 features (INST_ENSIZE being one of them)
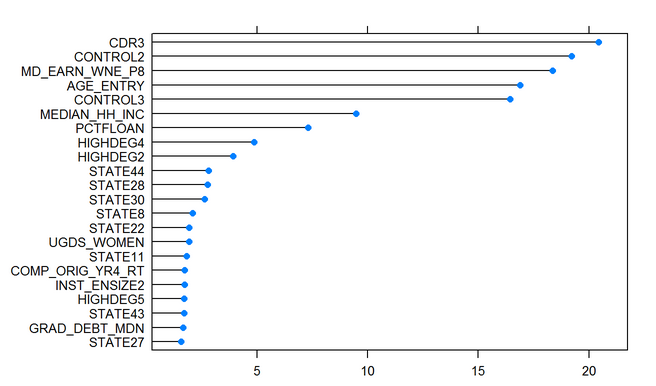
Feature importance using Lightgbm regressor
- CD3: Three-year cohort default rate
- Control3
- Median earnings of students working and not enrolled 8 years after entry
- The average age of entry
- Control2
- Median household income
- Percent of all undergraduate students receiving a federal student loan
- Highdeg4: Highest degree awarded (has 5 levels so level 2,4 and 5 were important)
- Highdeg2
- State44
- State28
- State30
- State8
- State22
- The total share of enrollment of undergraduate degree-seeking students who are women
- State11
- Percent completed within 4 years at the original institution
- INST_ENSIZE2: Institution Enrollment Size (Newly derived featured fro UGDS:[Enrollment of undergraduate certificate/degree-seeking students])
- Highdeg5
- State43
- The median debt for students who have completed
- State27
The above features are listed in the order of their importance which was obtained using Lightgbm regressor on the complete dataset.
And the following factors were considered while evaluating the financial aspect of attending a college:
- Cost.
- Amount of debt to be taken.
- Future earnings.
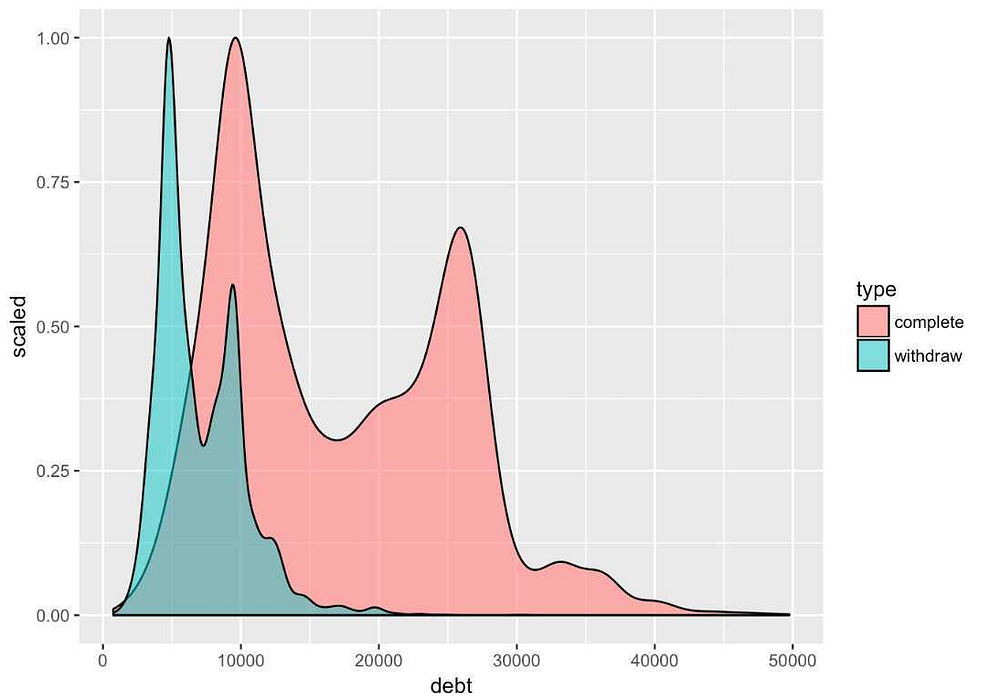
% of students who complete their course or withdraw from it vs the borrowed loan amount.
Target Variable
The target variable is obviously repayment rate = fraction of students properly repaying their loans, while lies in the range of 0–1. COMPL_RPY_3YR_RT is taken as the target variable which is defined in the data set as “Three-year repayment rate for completers”.
Student Segmentation
A total of 12 segments were made out of the data. The segments are clearly demarcated from other segments. These segments show that there’s a diverse set of students taking loans each year and hence have varied repayment capabilities based on what college they went to, which course they took up, their demographic data, financial profile, and age profile.
K-means was used to generate the clusters and the kneed library was used to find the optimal “k” value for the segmentation process. The explained variance of the clusters was 95% (after PCA)
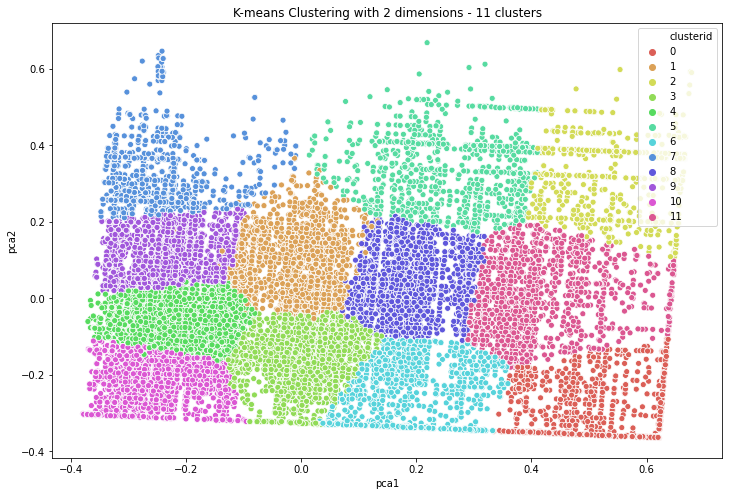
12 clusters obtained: represented in 2 dimensions using PCA
Next comes the modeling: Time for some insights
The student segmentation was followed by modeling the repayment capacity of the students to save them from lifelong debt.
The idea was to model the distinctive student segments using Gradient boosting regression. Linear regression came in handy to study the relationship between the median earnings and the average cost of the institution. The next thing was to work with different models like LightGBM, XGboost, and an ensemble of various other models to predict the repayment capability of a loan borrower. Finally, a stacked ensemble of XGBoost and Lightgbm performed the best when compared to all the other examples. The dataset was split into mutually exclusive training, validation, and test sets.RMSE has been used as an evaluation metric.
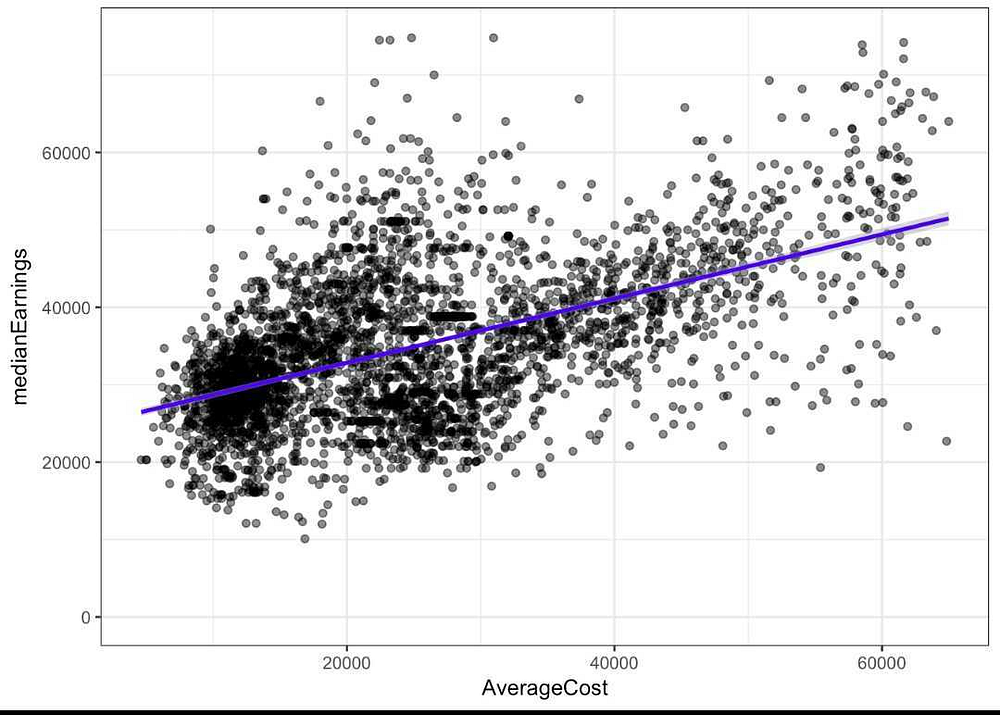
Relationship between the median earnings and the average cost of the institution.
The model predicts a number between 0–1. Let’s say the predicted value is 0.85, it implies that 85% it’s likely that that student will be able to repay the borrowed loan amount.
Quantitative Results
RMSE was used to evaluate the model. The RMSE value achieved on a sample of 30k students was 0.865 which proved that the model was able to predict the repayment capabilities pretty accurately given the data state and amount of pre-processing done to train a model.
Final thoughts
- The whole analysis throws light on the current state of repayment of loans and provides an AI-based approach to evaluate the risk incurred while borrowing a certain amount of money.
- As expected, borrowers with higher annual income and higher FICO scores are more likely to repay them completely.
- Also, borrowers with lower interest rates and smaller installments are more likely to pay the loan fully.
Key Insights
- Key takeaways from existing studies and reports:
a. Typically, repayment of government student loans begins six months after college graduation and can last up to 25 years.
b. Most borrowers pay their loans in ten years.
c. Students fail to make a payment on their student loan in 270 days, they are considered to be in default.
d. The average national two-year cohort default rate in the FSLP was 7 percent in 2008. - Understanding the data:
a. The clustering of data points based on institution level and debt repayment rate data was crucial in understanding the data distribution and how some categories stood out from the rest.
b. EDA in terms of analyzing repayment rates depicted patterns relating to how University and admission rates affected the median debt of students completing education.
c. Most of the schools associated with high debt are visual arts and design institutions.
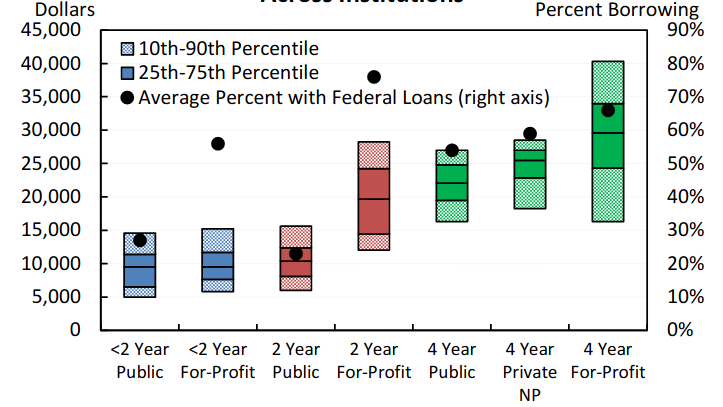
No of years loan borrowed along with the type of loan provider vs % borrowing amount for various sectors of loan providers
- Sources of bias:
a. A major bias introduced in this study by the collectors of the data is that the data is limited to students that are Title IV recipients. A Title IV award includes government loans and grants (4), and these are need-based awards. Thus, it is important to keep in mind that the conclusions we attempt to make using this data set are not general to all students, but rather only those that qualified for, or perhaps more importantly had access to financial aid.
b. The second bias in this study is that it only pertains to schools that received financial aid. Over 80% of schools receive financial aid, so this bias is not as severe as the one mentioned earlier. However, this data set is limited to students that received financial aid at a subset of available schools. - Important observations from the study:
a. The median and mean debt of those completing their education are over double than those that withdraw. However, more interestingly, we find that the populations for both groups appear to have a multimodal distribution.
b. Mean debt for those that complete their schooling is similar for those that attend private for-profit and public schools, but significantly higher for private nonprofit schools and the same is true for the debt taken on for those that withdraw before completing their education.
c. There is a linear relationship between the debt taken on by the students that complete their education for institutions that have an average cost < ~25,000, however, there is not a linear relationship for the higher-priced institutions. - Take on the hypothesis:
Based on the analysis the hypothesis that a student’s future earnings are maximized by attending the best school they can get into, despite the cost was also proved to be true through numbers and graphs.
This article is written by Laisha Wadhwa.


