
Analysing Sexual Abuse at the Workplace Using Supervised Learning
April 25, 2020

Nowadays, the severity of sexual abuse is gaining more and more traction, not just in the USA but throughout the whole world.
To help combat the problem, I joined an Omdena project together with the Zero Abuse Project. Among 45 Omdena collaborators from across 6 continents, the goal was to build AI models to identify patterns in the behavior of institutions when they cover-up incidents of sexual abuse.
My task: Overcoming an imbalanced data set
When it comes to data science, sexual abuse is an imbalanced data problem, meaning there are few (known) instances of harassment in the entire dataset.
An imbalanced problem is defined as a dataset which has disproportional class counts. Oversampling is one way to combat this by creating synthetic minority samples.
Together with other collaborators, I worked on an AI tool that evaluates the risk factors that suggest potential predatory individuals within an organization and those associated with the cover-up.
Our data consists of sexual abuse instances at work and their features. The data is provided by UNICEF.
Instances of sexual harassment is a reported case of sexual harassment which is concluded by law enforcement. The risk factors are going to be our features in the dataset. Features include; state, number of relocation and institution the person is connected to.
Since the nature of the data is sensitive and unique, I have predicted probabilities rather than classes for the prediction output type. In such questions, predicting either 0 or 1 may be too controversial.
To cope with the data imbalance problem and sensitivity, I decided to apply oversampling and implement a random forest model (supervised learning) to analyze the sexual abuse patterns.
The power of oversampling
SMOTE — Synthetic Minority Over-sampling Technique — is a common oversampling method widely used in machine learning with imbalanced high-dimensional data. The SMOTE technique generates randomly new examples or instances of the minority class from the nearest neighbors of a line joining the minority class sample to increase the number of instances. SMOTE creates synthetic minority samples using the popular K nearest neighbor algorithm.
K nearest neighbors draw a line between the minority points and generate points in the middle of the line. It is a technique that was experimented on, nowadays one can find many different versions of SMOTE which build upon the classic formula. Let’s visualize how oversampling affects the data in general.
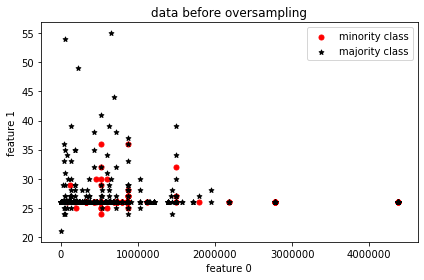
Visual representation of data without oversampling
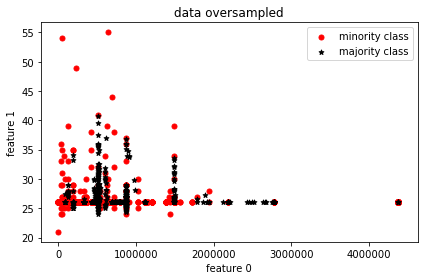
Visual representation of data with oversampling
For visualization’s sake, two features are picked and from their distribution, it’s clearly seen that the minority samples match the majority sample count.
Impact on the predictions
Let’s compare the predictive power of oversampling vs. not oversampling. Random Forest is used as the predictor in both cases. The ProWSyn version of oversampling is selected as the highest performing oversampling method after all the methods are compared using this[1] Python package.
Let’s check the performance of models pre and post oversampling.
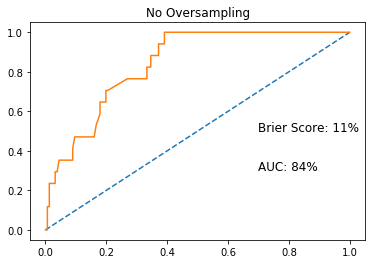
ROCAUC without oversampling
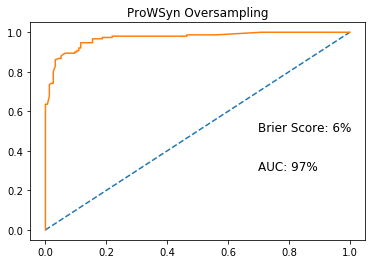
ROCAUC with oversampling
With ProWSyn oversampling implemented, we can see a 13% increase in ROCAUC score, which is the Area Under the Receiver Operating Characteristic curve, from 84% to 97%. I was also able to decrease the Brier Score[2], which is a metric for probability prediction, by 5%.
As you can see from the results, oversampling can significantly boost your model performance when you have to deal with an imbalanced dataset. In my case, ProWSyn version of SMOTE performed the best but this depends always on the data and you should try different versions to see which one works the best for you.
What is ProWSyn and why does it work so well?
Most oversampling methods lack a proper process of assigning correct weights for minority samples. This results in a poor distribution of generated synthetic samples. Proximity Weighted Synthetic Oversampling Technique (ProWSyn) generates effective weight values for the minority data samples based on the sample’s proximity information, i.e., distance from the boundary which results in a proper distribution of generated synthetic samples across the minority data set.[3]
What is the output?
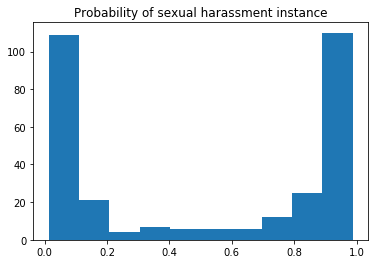
x: number of instances; y: probability
After the prediction, the histogram of predicted probabilities looks like the image above. The distribution turned out the be the way I imagined. The model has learned from the many features and it turns out there is a correlation within the feature space which at the end creates such a distinct difference between classes 0 and 1. In simpler terms, there is a pattern within 0 and 1 classes’ features.
More care has to be put into probabilities really close to 1 (100% probability). From the histogram plot above, we can see that the number of points near 100% probability is quite high. It is normal to dismiss someone as a non-predator but much harder to accuse someone, therefore that number should be lower.
What’ next?
I shared a description of applying supervised learning for sexual abuse data.
I was able to identify the main problem, which was the class proportion in target values. Since predicting probabilities in such a sensitive subject required a well-functioning and thought out model, I wanted to fix the biggest problem by creating synthetic instances of sexual harassment in the dataset and have the model it that way. As a result, the predicted probabilities, or red flags, have shown a high level of Brier Score and AUC which means a higher probability prediction performance.
These high scores mean a much better predictive performance in plain English. But this is a double-edged sword, as the model would have a large number of highly probable sexual harassment entities on future data.
Since this machine learning task is much more sensitive than for example predicting the price of second-hand cars, these high probabilities may lead to complications. Having more training data and using a very high threshold may overcome this problem.
Sources
[1] https://github.com/analyticalmindsltd/smote_variants
[2] https://link.springer.com/chapter/10.1007/978-3-642-37456-2_27
[3] https://en.wikipedia.org/wiki/Brier_score
This article is written by Mertcan Coskun.
Want to work with us too?


