

Every rooftop solar sale starts with an assessment. For this client, that assessment consumed 30-40% of the pre-sales budget and took up to two full days per building. This project set out to replace it with a satellite image.
Executive Summary
Rooftop solar has a sales pipeline problem. Before a developer can quote, design, or commission a system, they need five data points for every building: obstacles, usable area, roof material, orientation, and slope. Gathering that manually takes an hour for a simple building and up to two full days for a complex commercial property, consuming a significant share of the project budget before a single panel is installed.
Omdena built a computer vision pipeline that extracts all five rooftop attributes from satellite imagery without requiring a surveyor to visit the site. The system uses instance segmentation to identify and isolate individual rooftops from high-resolution satellite images, then extracts each roof’s obstacles, usable area, material type, orientation, and slope, producing structured solar potential data ready for sales and design workflows.
The pipeline was built and validated in Singapore over eight weeks, with Mask R-CNN selected as the segmentation model after evaluation against YOLACT and Detectron2. It processes entire cities from a desktop, meaning the pre-sales survey cost does not scale with the number of buildings assessed. The result is a shift from field-heavy, building-by-building assessment to a scalable, data-driven process in which site visits follow after the pipeline has already identified the most viable targets.
| KEY FINDINGS | |
| 30-40% of the project budget | Consumed by manual pre-sales rooftop surveys, based on the project’s baseline analysis of the client’s assessment workflow |
| 1 hour to 2 full days | time required per building for manual assessment, depending on access, roof complexity, and documentation availability |
| 5 attributes per rooftop | extracted automatically: obstacles, usable area, roof material, orientation, and slope |
| No site visit required | At the pre-sales screening stage, the full rooftop profile is generated from satellite imagery alone |
| Mask R-CNN selected | outperformed YOLACT and Detectron2 on rooftop instance segmentation across the 500+ annotated tile dataset |
| Scales to the city level | pipeline processes entire cities from satellite data without additional field resources |
Why Manual Rooftop Assessment Is Holding Solar Growth Back
The solar rooftop market is constrained less by technology than by the cost of identifying where to deploy it. Assessing which buildings are viable is a manual, site-by-site process: each building requires a surveyor to visit, photograph the roof, measure obstacles such as HVAC units, water tanks, and skylights, calculate available panel area, document the roof material, and note the orientation and pitch. That process repeats across every building in the pipeline.
For large commercial properties, the process can require multiple visits and coordination with building management; for residential portfolios, costs accumulate quickly when dozens of assessments precede the first contract. This is part of a broader soft-cost problem: NREL benchmarking (2025) documents that soft costs account for up to 65% of total residential solar system costs in the United States. Pre-sales rooftop surveys are a significant contributor, incurring costs that scale with each building assessed rather than with each system installed.
The consequence is not just cost. It is selectivity. Developers cannot afford to survey every building that might be viable, so they rely on rough estimates and heuristics to prioritise. Buildings that would have been excellent candidates are never assessed. Viable projects die in the pipeline before they reach the stage where a proposal is even prepared. Computer vision addresses this directly: it makes assessment cheap enough to run at full portfolio scale, which changes what developers can know before they commit field resources.
Why Satellite Imagery Is the Right Input
High-resolution satellite imagery provides a top-down view of rooftops at the level of detail needed for solar assessment: individual obstacles are visible, roof edges are distinct, and material textures are differentiable. Each satellite image of Singapore was approximately 2GB in size, so the team tiled the images into thousands of smaller analytical units, allowing the model to focus on one roof section at a time and improving both detection accuracy and processing speed.
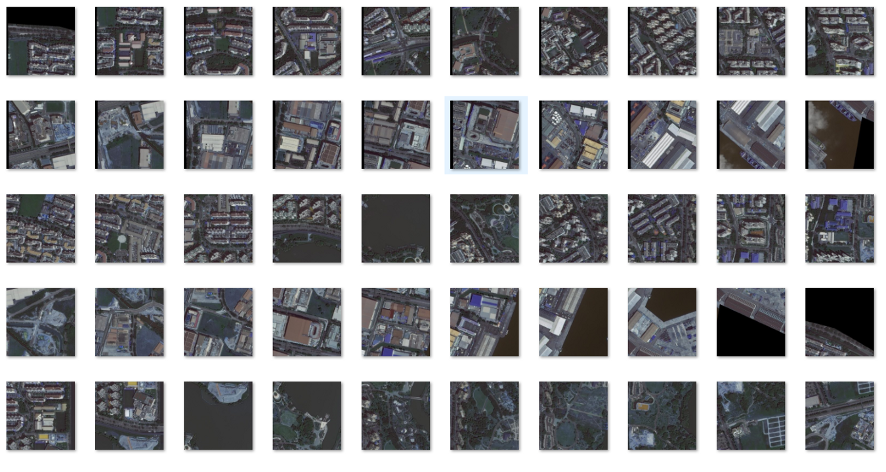
Annotations were created using OpenStreetMap building footprints and cross-referenced in QGIS, providing a training dataset with geographically grounded labels at the individual rooftop level. The resulting dataset covered more than 500 annotated tiles across Singapore’s rooftop landscape, including residential blocks, commercial properties, mixed-use buildings, and industrial rooftops, with varying obstacle densities and material types.
Singapore was a deliberate choice as the validation environment. As one of the most densely populated urban environments in Southeast Asia, it represents a demanding test case. Rooftops are close together, often partially shadowed by adjacent structures, and frequently obstructed with equipment. A pipeline that performs reliably in Singapore transfers well to less dense markets, making the validation environment a meaningful test of real-world robustness.
How the Pipeline Works
| INPUT: High-Resolution Satellite Imagery (Singapore rooftop coverage) | ||
| ↓ | ↓ | ↓ |
| STAGE 1 | STAGE 2 | STAGE 3 |
| Rooftop Detection
Mask R-CNN instance segmentation: identifies and isolates each rooftop polygon |
Feature Extraction
5 attributes per rooftop: obstacles, usable area, material, orientation, slope |
Assessment Output
Structured solar potential data per building, ready for sales and design workflows |
| ↓ | ||
| OUTPUT: Per-Building Solar Profile → Pre-Sales Assessment Data (no site visit) | ||
How the Vision Model Detects Rooftops
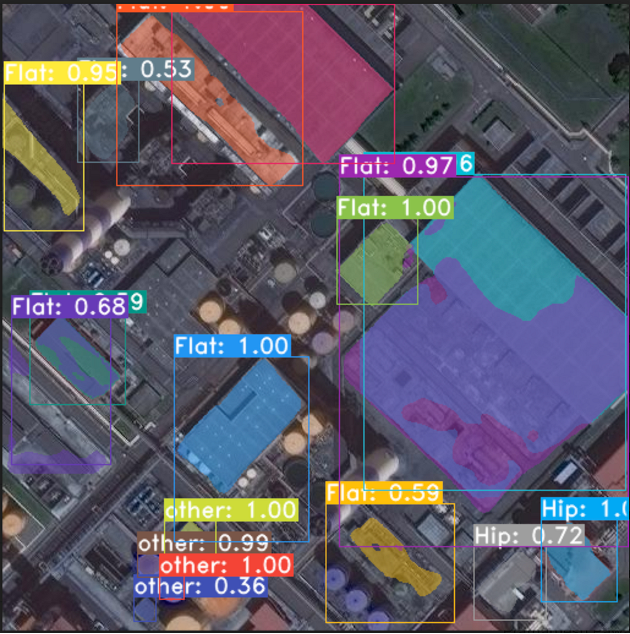
The core detection task is instance segmentation: identifying each rooftop in a satellite image and producing a precise pixel-level boundary for it. Unlike object detection, which draws bounding boxes, instance segmentation produces exact outlines that follow roof edges, gutters, and setbacks. That precision matters for solar assessment because usable area depends on accurate boundary delineation. A bounding-box approach overestimates the roof area; instance segmentation does not.
Three model architectures were evaluated: Mask R-CNN, YOLACT, and Detectron2. Mask R-CNN was selected based on its segmentation performance across the full range of building types in the Singapore dataset. Independent research on Mask R-CNN applied to satellite PV imagery confirms the architecture’s suitability: it handles partial occlusion, overlapping rooftops, and irregular building geometries more reliably than the alternatives tested, which matters most in the dense urban environments where solar deployment is commercially concentrated.
The model was trained on the 500+ annotated tile dataset and validated against held-out imagery not seen during training. Training data was sourced from diverse building types to avoid the common failure mode of high accuracy on uniform residential rooftops but poor performance on commercial or mixed-use properties.
What the Pipeline Extracts from Each Rooftop
Once a rooftop boundary is identified, the feature extraction pipeline runs five separate analyses. Together, they produce the complete data profile a solar developer needs to move from assessment to proposal without visiting the building.
Obstacle Detection
The pipeline identifies, locates, and maps rooftop obstacles: HVAC units, water tanks, lift motor rooms, skylights, and other equipment that reduces available panel area. Each obstacle is located and its footprint estimated, showing which sections of the roof are available and which are blocked. In dense urban environments, particularly on commercial and mixed-use buildings, obstacle coverage can reduce usable area by 30-60% relative to total roof area, making obstacle detection one of the most actionable outputs the pipeline produces.
Usable Area Calculation
After obstacle mapping, the pipeline calculates the net usable roof area: total roof boundary minus obstacle footprints, setback margins, and access paths required by installation standards. The output is a square-metre figure per building, ready for use in panel count calculations and system sizing. For a developer producing preliminary proposals across a pipeline of 50 buildings, this replaces 50 manual measurements with a single pipeline run.
Roof Material Classification
The pipeline classifies each rooftop by material type: concrete, metal, tile, Eternit, or composite shingles. Material classification determines whether a roof needs structural modification for panel fixings, what mounting system is appropriate, and whether waterproofing is required. These are direct inputs to the installation budget. Knowing the material type before the site visit means the developer arrives with the right equipment specification rather than discovering mid-survey that the mounting approach needs to change.
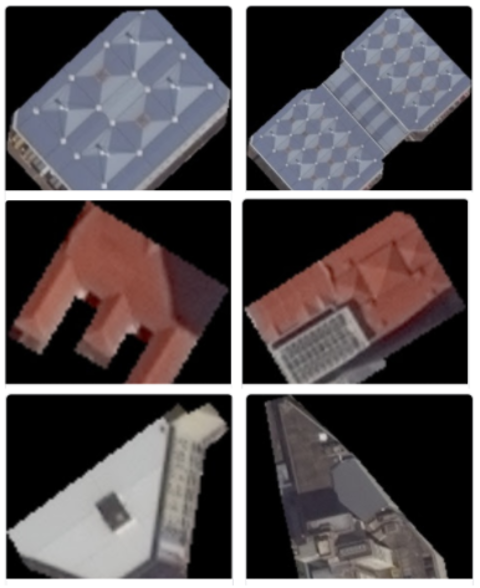
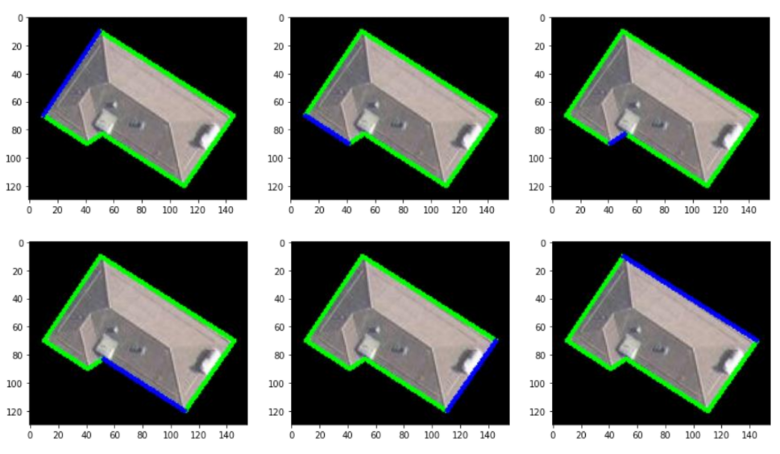
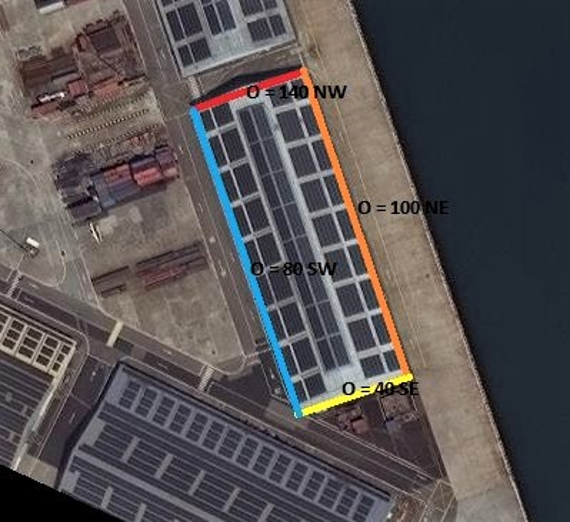
Orientation and Slope Estimation
Panel yield depends heavily on the direction a roof faces and its pitch. The pipeline extracts azimuth orientation and estimates slope from the satellite imagery, flagging rooftops where orientation or pitch falls outside the productive range. Singapore’s equatorial position means flat rooftops often match or outperform steeply pitched surfaces. Slope estimation from 2D satellite imagery is inherently a range calculation rather than a precise measurement; the pipeline produces a bracket suitable for pre-sales screening, with detailed pitch verification reserved for the site survey that follows.
What the Pipeline Delivers
The first shift is time compression. A building that previously required one to two days of surveyor time to assess is now profiled in seconds. Across a portfolio of hundreds of buildings, that is not incremental improvement; it is a different class of process.
The second shift is cost. Manual assessment scales linearly with every building surveyed, but the pipeline does not. Running it across 500 buildings costs roughly the same as running it across 50, allowing developers to screen entire districts and reserve field time for confirmed high-value targets.
The third shift is structural. At present, the sales cycle starts with a site visit and ends with a proposal; with the pipeline, it starts with a data run, moves to a ranked target list, and the site visit follows only after each building has been screened. The output is structurally consistent across all buildings assessed, enabling portfolio-wide ranking and market analysis that are not practical when assessment data reside in surveyors’ field notes.
The fourth shift is transferability. The pipeline was built and validated in Singapore, but its inputs are globally available satellite imagery, and its core model architecture is not location-specific. Omdena has applied the same satellite-first principle to floating solar site assessment, where remote screening replaces reservoir field surveys before any capital is committed. The tool moves with the portfolio rather than requiring a separate assessment infrastructure in each geography.
Challenges and Limitations
Using this pipeline effectively requires understanding what it does well and where its boundaries sit. Four constraints are worth stating directly.
Annotation Cost for New Geographies
Building the 500+ tile training dataset required significant annotation effort before the pipeline was operational. For a new city with comparable building stock, fine-tuning typically takes two to three weeks; for a region with substantially different building types, a larger dataset may be needed. For developers entering a single market, this is a one-time cost; for those operating across many geographies, it is a recurring investment to scope the deployment plan from the start.
Image Resolution and Cloud Cover
Pipeline performance depends on the resolution of satellite imagery. In regions where high-resolution imagery is sparse, less current, or frequently obscured by cloud cover, detection accuracy and feature extraction quality are affected. This is particularly relevant in tropical markets where persistent cloud cover limits the number of usable acquisition windows. Imagery acquisition strategy, including source, recency, and cloud-mask filtering, is as important to output quality as the model itself.
Model Transfer to Different Urban Morphologies
The core pipeline was trained and validated on Singapore’s urban building stock, which has a distinct rooftop profile: high-density, predominantly flat, heavily obstructed. Buildings in markets with steeply pitched rooftops, different dominant materials, or obstacle types may show reduced detection confidence until the model is exposed to representative training examples. Transfer to a new market works best when accompanied by a targeted fine-tuning run on locally annotated imagery.
Slope Estimation Precision
Roof slope is estimated from 2D satellite imagery rather than measured directly. The pipeline produces a reliable range bracket that is sufficient for pre-sales screening and for prioritising viable buildings. It is not a substitute for the precise pitch measurement that structural and engineering teams require for final system design, or for 3D roof reconstruction workflows that generate precise roof geometry for detailed PV layout. The correct use of the slope output is to filter out clearly unsuitable rooftops early, with detailed verification handled at the site survey that follows for shortlisted buildings.
How This Works in Practice
A solar developer preparing to enter a new district runs the pipeline across the full building stock before any sales activity begins. Within hours, every rooftop has an assessed profile: usable area, obstacle map, material type, orientation, and slope. Rooftops below the minimum viable panel count are filtered out; those with poor orientation or slope are flagged. The remaining list is ranked by estimated yield, surveyors are deployed only to the top tier, and field teams arrive with a full data briefing rather than starting from scratch.
A developer already active in a market uses the pipeline to identify upsell opportunities within an existing customer base. Buildings that were assessed manually two or three years ago are re-screened using current satellite imagery to check whether roof conditions or obstacle profiles have changed. New buildings added to managed portfolios are assessed and scored before the account manager picks up the phone. The pipeline becomes part of the ongoing commercial process, not just a one-time deployment tool.
The Numbers
| Metric | Result |
| Manual assessment time | 1 hour to 2 full days per building |
| Pipeline assessment time | Seconds per building at scale |
| Pre-sales survey cost baseline | 30-40% of project budget (project measurement) |
| Soft costs, residential solar | Up to 65% of total system cost (NREL, 2025) |
| Attributes extracted | 5 per rooftop (obstacles, area, material, orientation, slope) |
| Dataset size | 500+ annotated satellite image tiles |
| Models evaluated | Mask R-CNN, YOLACT, Detectron2 |
| Model selected | Mask R-CNN (best segmentation performance) |
| Site visit required | Not at the pre-sales stage |
| Geographic scope | Scalable to the city level from satellite data alone |
| Project timeline | 8 weeks |
About the Project
Omdena led this project on AI-powered rooftop solar assessment for a Singapore-based solar developer across four parallel engineering streams: satellite image preprocessing and tiling; rooftop instance segmentation with Mask R-CNN; obstacle detection and usable area calculation; and roof attribute extraction covering material, orientation, and slope. The parallel structure compressed the eight-week timeline and let each stream’s outputs inform the others.
Combining satellite imagery processing, instance segmentation, and multi-attribute feature extraction within a single pipeline is a multi-domain scope that typically requires an enterprise AI team. Omdena delivers that capability at around a third of what enterprise AI development typically costs, through a proprietary agentic AI platform and a structured delivery process.
If you are working on rooftop solar feasibility, pre-sales assessment automation, or looking to apply computer vision to satellite and aerial imagery at city scale, reach out to Omdena to discuss how this approach applies to your context.


