
Modeling Economic Well-being through AI, Satellite Imagery, and Census Data
Using AI to develop a baseline for detecting the economic well-being in India. Project hosted by World Resources Institute.

November 16, 2020
10 minutes read

Economic well-being is a broad concept that goes beyond statistical metrics. When you plan on moving to another place, do you primarily check complex economic measures like the GDP of that region? When making such decisions, generally what matters to most people, in layman terms, is the standard of living. The standard of living refers to the necessities, comforts, and luxuries which a person is likely to enjoy. It refers to the quantity and quality of their consumption. The fundamental reason for differences in the standards of living between regions is the difference in their levels of economic productivity.
Hence, it is important for nations to record a source of primary data that provides valuable information for planning and formulating policies by governments, international agencies, scholars, business people, industrialists, and many more.
This data is usually collected through on-site surveys that need to be performed across vast areas. A list of questions is asked from families and individuals which leads to a huge database.
The Problem
These surveys are conducted over a period of a few years and involve huge manpower and expenditure.
Indian Census 2011 costed INR 2200 Crores (USD 295 million)
There are also associated risks of abuse of data and corruption. Also, the temporal variation of factors affecting economic well-being makes it all the more difficult to compare the progress of regions.
Instead, we try training AI models to learn features related to the changing agricultural and urban landscape thus providing a better understanding of economic well-being.
World Resources Institute (WRI) is a global research organization that spans more than 60 countries and works towards turning big ideas into action at the nexus of environment, economic opportunity, and human well-being.

WRI
WRI brings up an enlightening problem statement — Creating a machine learning algorithm that can be used as a proxy for socio-economic well-being in India, using a remote sensing approach through satellite images.
In order to make this possible, Omdena brought together 40 AI -Engineers from 20+ countries, to collaborate on this project. The aim was to create a prototype that can be used to predict variables or features that represent the standard of living of a place, particularly in data-poor regions. This remote approach would use AI and Computer Vision to extract latent features from satellite images, that can help build a baseline model.
How we solved it
In this article, we’re going to highlight one of the final delivered models based on Indian Census Data. The aim of this economic well-being AI model is to use satellite images and classify each region as a high, medium, or low economic well-being region.
1. Preparing the Ground Truth
In anticipation of the upcoming Census 2021, WRI expressed a major interest in working on its census dataset as there was a need to prepare the model for the upcoming release.
The census data (AI) is an official survey of the population which attempts to gather socio-economic well-being information of households in a specific region and time frame.
Our panel data team mobilized to quickly scrape the Census-2011 website for the District-level household data. There are a number of features representing the condition of houses and assets owned. We wrote a script that extracted these features for each of the 640 districts present in India, in one single CSV file.
We followed the methodology described in this research paper as a guide for our workflow. The census data were subdivided into groups and the features were reduced. We formulated these six variables according to existing research:
- Fuel for Cooking
- Main Source of Water
- Main Source of Light
- Condition of Household
- Material of Roof
- Assets Owned
All of these six variables had three categories :
- RUD (rudimentary): Features that represent primitive methods such as using firewood, river water, poor house condition, grass roof, etc.
- INT (intermediate): Features that represent medium-grade methods such as using kerosene for lighting, tubewell water, owning a liveable house, etc.
- ADV (advance): Features that represent the better condition of households such as owning a car. using electricity, tap water, etc.
After this division, we applied K-means clustering to identify three clusters belonging to the above categories. Each cluster was AI-visualized using a box-plot to associate it with a level of economic well-being.
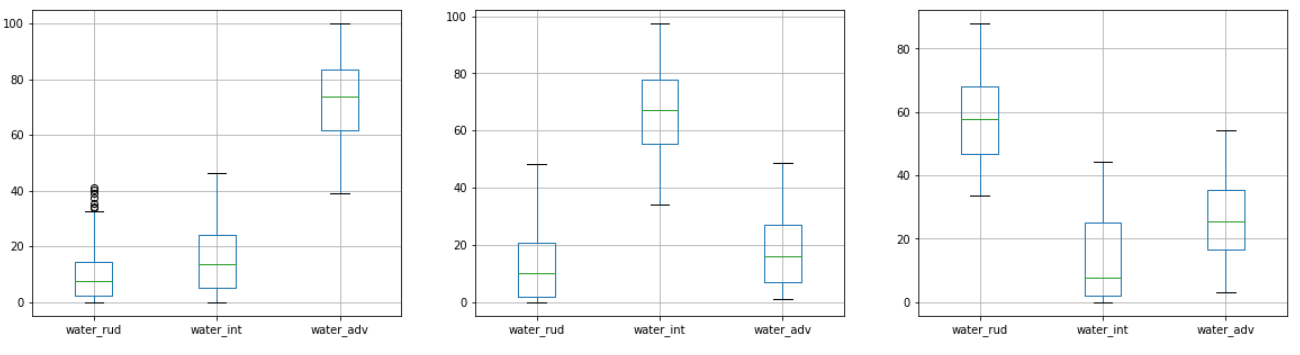
Example: Three Clusters for Variable — Main Source of Water / Source: Omdena
In the above image, we see three clusters represented by three plots. Each one is telling if it belongs to the Low, Medium, or High economic well-being class. Cluster 1 depicts ‘High’ (since water_adv is the highest), cluster 2 depicts ‘Medium’ (since water_int is the highest) and cluster 3 depicts ‘Low’ (since water_rud is the highest).
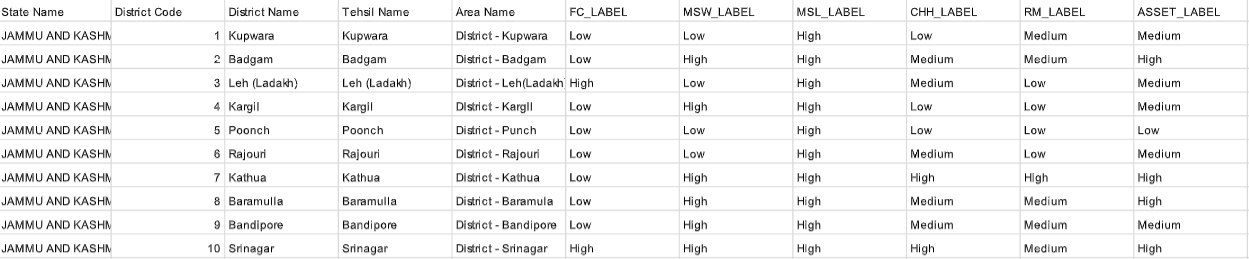
This was done for all 6 variables. After this pre-processing of Census data, our dataset looked like this:
2. Satellite Image Acquisition
After the ground truth was set up we needed satellite images corresponding to those 640 districts. We had to rely on open-source satellite images, so we selected Google Earth Engine’s services to download these images.
Google Earth Engine provides datasets from various satellites. Since we used census data from 2011 we required the images for the districts corresponding to that year. From the two popular satellites: Sentinel 2 (which has AI data is available from 2015) and Landsat 7 (which has data available from 1999), we selected Landsat 7 Tier 1 TOA Reflectance as our satellite imagery collection, in order to acquire images from 2011.
Landsat 7 images have 30m/pixel resolution which means that every pixel of the image covers 30 meters on earth!
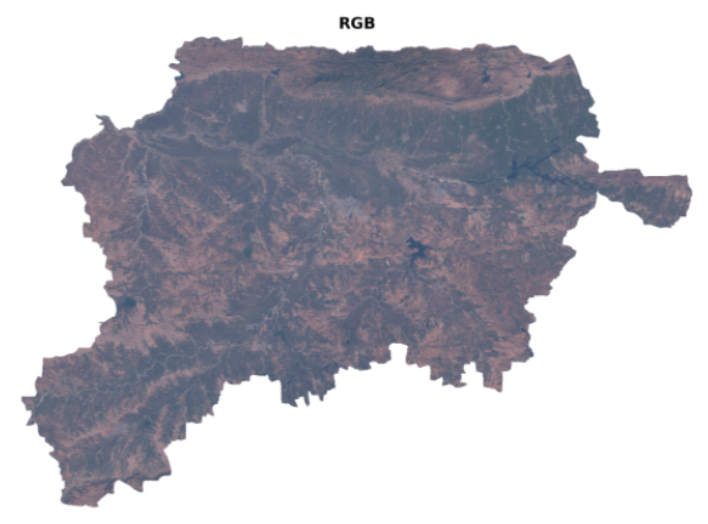
Jalgaon, Maharashtra / Source: Omdena
Next, we decided on the bands we would need in our satellite image. The images stored in our devices contain 3 bands (Red, Green, and Blue). However, satellite images are multi-banded in nature and may contain up to 12 bands. Not all of them would be useful for us, so we settled on Red, Green, Blue, NIR (Near InfraRed), and SWIR-1 (Shortwave InfraRed) bands.
The image of any particular region will vary depending on what time it was taken, the cloud cover, angle of the satellite, etc. Google Earth Engine allows us to filter out all the best images that we can get for a region throughout our time period and then aggregate them into one single image composite. We downloaded 640 median aggregated image composites, each image corresponding to our districts.
3. Creating Features from Images
Every raster that we downloaded contains 5 bands, we merged these bands in different ways to analyze the geographical features of that region.
For example, if we merge the Near Infrared and the Red bands together using the formula, (NIR — RED) / (NIR + RED), we will get a single-band image. We call this the NDVI of our image, which stands for Normalized Difference Vegetation Index.
The special thing about this image is that all the pixels with any shade of green are highlighted. This basically tells us where in the district there is a higher concentration of vegetation. Vegetation is also an indicator of economic well-being, so we can use the NDVI image as an input to our AI model.
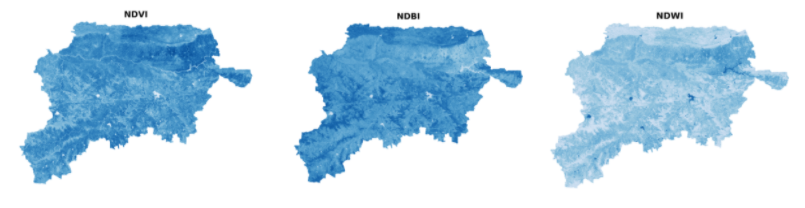
Different indices highlight different features on the map. See below for more details on each index. Source: Omdena
Similarly, we can combine the SWIR band with the other bands to get other indices. Apart from the NDVI we also calculated the NDBI (Normalized Difference Built-Up Index) and the NDWI (Normalized Difference Water Index). As the name suggests the NDBI highlights the concentration of the built-up areas and NDWI highlights the water content, both of which could be indicators of social well-being.
4. Model Architecture
The inputs and expected outputs were ready! The task was to build an image classification model. Most of the available pre-trained models are for RGB images. However, satellite images contain multiple bands. So we decided to generate 3-band images using the extracted indices.
To be able to use transfer learning, as well as utilize all the features in our images, we came up with the following architecture:
A Multi-modal Multi-task Deep Learning Model — It inputs two images and outputs values for multiple variables.
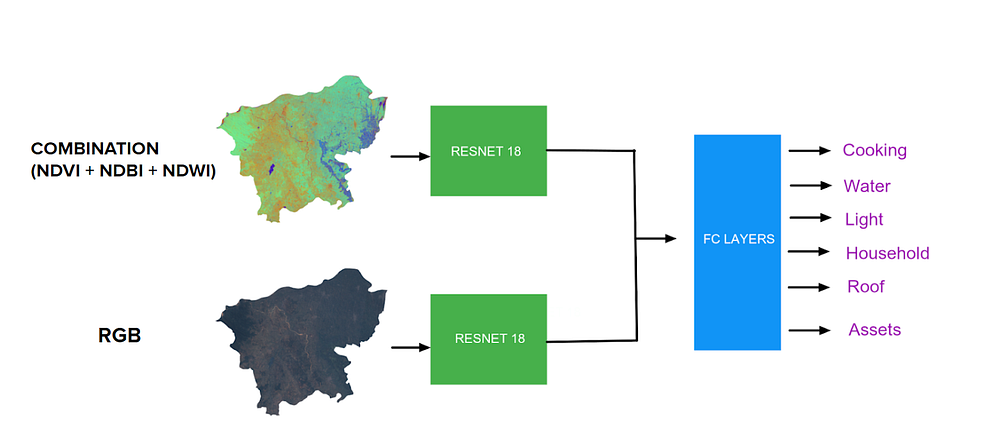
The Multi-modal Multi-task Deep Learning Model. Source: Omdena
We take two inputs:
- The first is an RGB image, which is just like any normal image we look at, containing the Red, Green, Blue bands.
- The second is a combination of the NDVI, NDBI, and NDWI of our image.
– NDVI — Normalized Difference Vegetation Index
– NDBI — Normalized Difference Built-up Index
– NDWI — Normalized Difference Water Index
This new image highlights a mixture of features corresponding to vegetation cover, built-up area, and water bodies of that region.
We then rescale the pixels to the 0–255 range so that the pre-trained models can be used with them.
Our data was divided such that all states are represented well in the model. 80% of districts of each state went to the training set and 20% went to the test set. Our model was subjected to a clever 10-fold cross-validation scheme, which means that the entire dataset was given a chance to undergo the economic well-being prediction by the AI model.
Images are passed through a popular Deep Learning Neural Network architecture — RESNET-18, combined with a fully connected layer to get our desired outputs. The model outputs three classes (high, medium, low) for multiple indicators as mentioned above. Hence, we solved a multi-modal multi-task learning problem. The model achieved an overall accuracy close to 70%.
Results and Insights
To analyze the overall development of a region based on the six different indices, we curated an Overall Development Index (ODI) to judge the economic well-being of a region as a whole. The index score calculated for each district ranged from 6 to 18 and was calculated as follows:
Overall Development Index (ODI) = A1+A2+A3+A4+A5+A6, where

Ax = 1 if Ax = “Low”
   = 2 if Ax = “Medium”
   = 3 if Ax = “High”
x: Type of Index
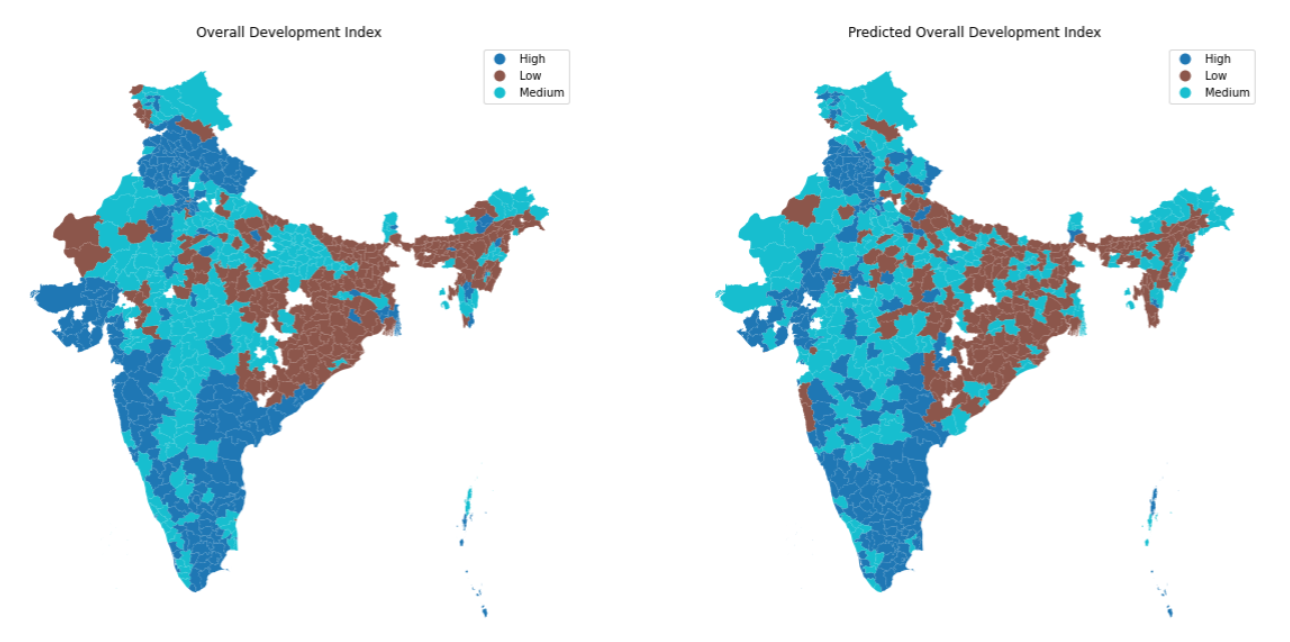
Ground Truth vs Model Predictions of Overall Development Index for Census 2011 / Source: Omdena
Driven by our curiosity and project interests, we also decided to deep dive into our data to uncover hidden statistics and actionable insights. Subjecting the data to a popular technique called Exploratory Data Analysis and with the help of BI tools like Tableau, Google Data Studio — we created dashboards to visualize the data in different customizable views.
We discovered that the districts of India were almost evenly distributed in terms of High, Medium, and Low Overall Development.
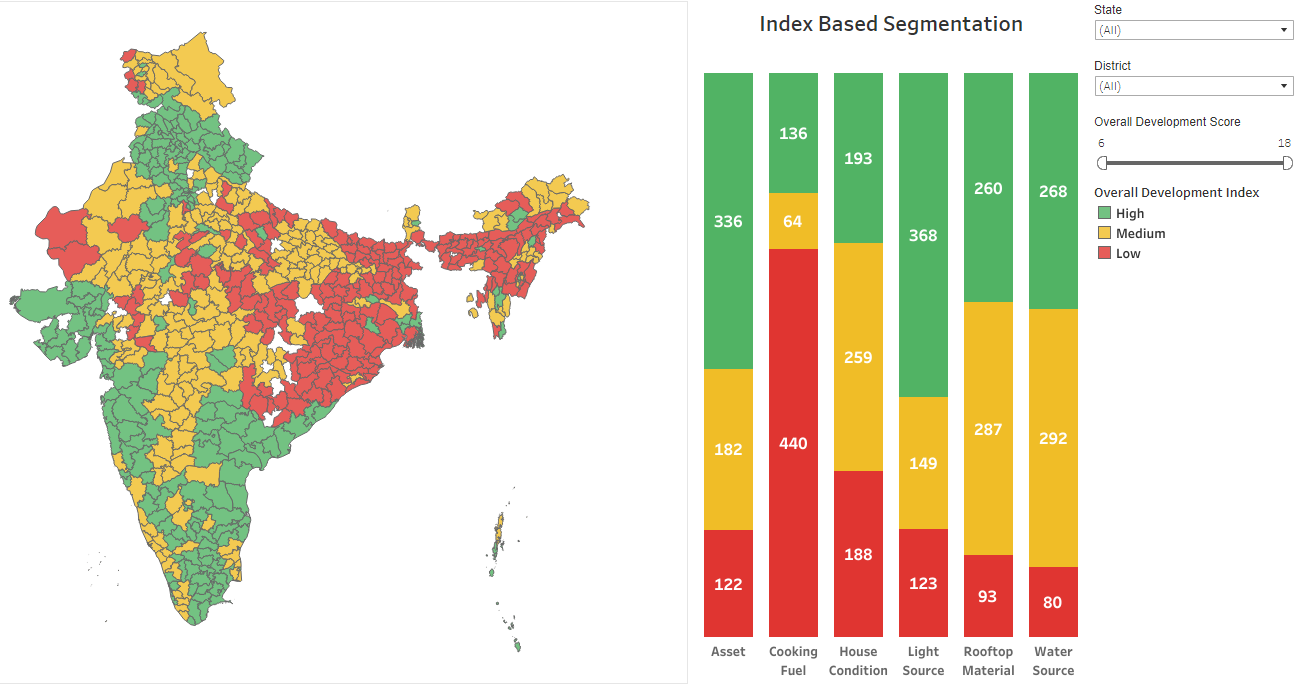
Distribution of Districts by the Overall Development Index for each indicator of economic well-being. Source: Omdena
Conclusion
Satellite images can act as a great proxy for existing data collection techniques such as surveys and census to predict the economic well-being of a region. It also makes it possible to determine the economic well-being of areas that are inaccessible to humans, for example, the rocky terrains of the northeastern region of India, the Himalayas or villages in the deserts.
The model is highly scalable and adaptable and can be trained on existing satellite imagery and surveys of other countries as well. It can help save a lot of manpower and time which acts as a major challenge in our existing development assessment initiatives. The prototype developed by our team in this eight-week challenge can be a springboard to a wider and in-depth expansion of this machine learning tool for predicting economic well-being.
With rapid advancements in technology, possible future work can include using high-resolution images or other popular datasets such as the Demographic and Health Survey (DHS) or Living Standards Measurement Surveys (LSMS) as the ground truth. Future applications also include tracking urbanization along with vegetation cover over a period of time. This can reflect on how the socio-economic conditions of regions evolve along with changing environmental factors.
This article is written by Harshita Chopra along with collaborators Arpan Mishra, Precioso Gabrillo, and Raghunath Pal.
You might also like


