AI & the Digital Divide: Analyzing the Impact of Digital Connectivity on Human Development (With UNDP)
7 min readUpdated November 8, 2024
Omdena
Applying AI to identify causal factors of the digital divide and their impact on human development.
“Technology is changing the world” is something we read and experience every day. The Internet of Things (IoT), cloud storage, big data, artificial intelligence, and social media are driving companies to pour millions into digital transformation initiatives. While we are making innovative advances in every sector of the economy, we need to analyze a critical question — Is the ‘technology’ accessible to everyone?
The gap caused by inequality in access to Information and Communications Technology (ICT) becomes even wider when we talk about regions — according to data taken from the Internet World Stats portal as of October 2020, only 47.1 % of inhabitants of Africa had Internet access, compared to 87.2 % of Europeans and 90.3 % of Americans. Technology has the potential to further divide humans on a class level. Those who can afford it have significant benefits in their day-to-day life while, those who have no access, remain disconnected or don’t receive the same level of service.
Adding to this problem, COVID-19 has changed the role and importance of connectivity. Access to the Internet has enabled many of us to get on with our lives despite the pandemic, thanks to modalities such as remote working and online education, but the reality isn’t the same all over the world. United Nations Development Programme (UNDP) brought forward a project on Omdena’s platform to identify causal factors that have increased the digital divide for particular groups. This holds the potential to assist governments to address the digital divide and design policies that connect their citizens.
The Problem Objective
The main goal of our project was to analyze the digital connectivity trends around the globe and, how these trends affect the economic and human development indicators of the countries. Additionally, we emphasized uncovering crucial factors that are associated with the stumbling block of the digital divide. As governments transition public services to digital in the wake of COVID-19, another aspect of the project illustrates how exclusion from connectivity can have a compounding impact on exclusion from public benefits.
The Solution
We analyzed multiple aspects of the problem by defining the factors that can contribute to the digital divide. Distribution of age, people with disabilities, e-government policies, education, gender differences, and infrastructure of a nation shape the access to digital services. Correlation analysis, clustering of countries, and regression modeling were used in various tasks to identify the effect of these factors on the Human Development Index and Gross Domestic Product. An interactive dashboard to study the in-depth relationships among the defined variables was created as a part of the final deliverable.
The task of gathering multiple relevant datasets led us to create a data dictionary for our project.
“A data dictionary is a collection of names, definitions, and attributes about datasets that are being used or captured in a database, information system, or part of a research project.”
The metadata included in our data dictionary assisted in defining the scope and characteristics of data elements, as well as the rules for their usage and application. Data acquisition was composed of various sub-activities, namely scraping web data, extracting columns from the different datasets, and combining multiple datasets to generate another extensive dataset.
The process of data acquisition had the following attributes:
SURVEY all tasks to acquire data sets
CATALOG all identified data sources outlining contents in an accessible format
ACQUIRE new data in concern with requesting project member
Gender Divide and the Development of Countries
I love technology, and I don’t think it’s something that should divide along gender lines. ~ Marissa Mayer
Importance of gender-related metrics for predicting HDI / Source: Omdena
One of the directions we followed deals with a vital question — How do different gender-specific features affect the Human Development Index (HDI) of a country?
The plot on the left is the result of applying Support Vector Regression (SVR) to our dataset evaluating feature importance concerning the Human Development Index (our target variable, in this task).
The results of SVR, Decision Tree, and various regressions algorithms provided us insights into the significant features which we used in training our Machine Learning (ML) models.
Digital Restrictions in Democracies
Connectivity is productivity — whether it’s a modern office or an underdeveloped village. ~Iqbal Quadir
A major factor influencing the digital divide is the availability of quality internet and access to online information. People from developing countries often have none or restricted access to various information that is crucial for their wellbeing. In this task, we aimed to analyze whether limited internet access or restrictions of various forms have an impact on human growth.
Insights
We found relationships between factors of technological limitations and internet censorship with HDI. Two models were created: one for Internet censorship and another one for Technical restriction, both giving significantly accurate predicted HDIs. The results led to a conclusion that these independent factors have high associations with HDI and using the linear regression model, one could hypothesize how changes in each feature could reflect on the target variable.
Government’s Digitization Approach
Within this task, we investigated the relationship between the digitalization of public services and the Human Development Index (HDI). As a proxy for that, we used The E-Government Development Index (EGDI) developed by the United Nations Department of Economic and Social Affairs (UNDESA).
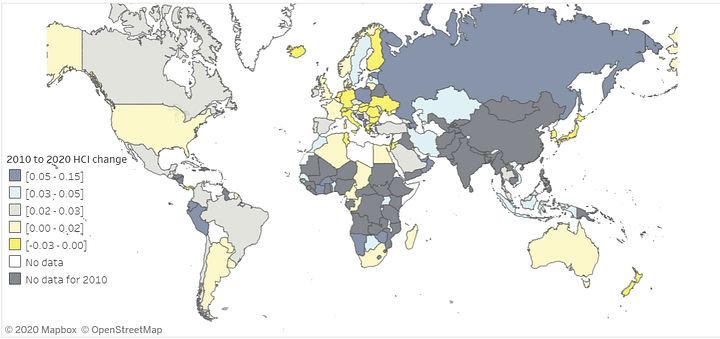
Change in HCI(Human Capital Index) from 2010 to 2020 /Source: WorldBank.org
To enlarge our dataset and the reliability of our models, we decided to use all possible historical values of EGDI and HDI starting from the year 2003. We also assumed that there is a positive relationship between these two indices, that is, higher EGDI will correlate with higher HDI which was confirmed with preliminary visualizations.
Insights
To predict the impact of EDGI on HDI, we ran a series of predictive models including linear regression, decision tree, random forest, and support vector machine. In conclusion, we found an expected positive relationship between HDI and EDGI and were able to preliminarily model this relationship.
An interesting avenue for future modeling would be to add other potentially important features related to government & policy digitalization. During the exploratory analysis, we found that even though features are highly correlated, there are some countries that exhibit relatively high HDI and yet low EDGI or vice-versa. It suggests that there are latent factors that play an important role here and the reduction of features by calculating principal components depicting high-variance holds the potential to surface as an efficient approach.
Disability Index and Connectivity
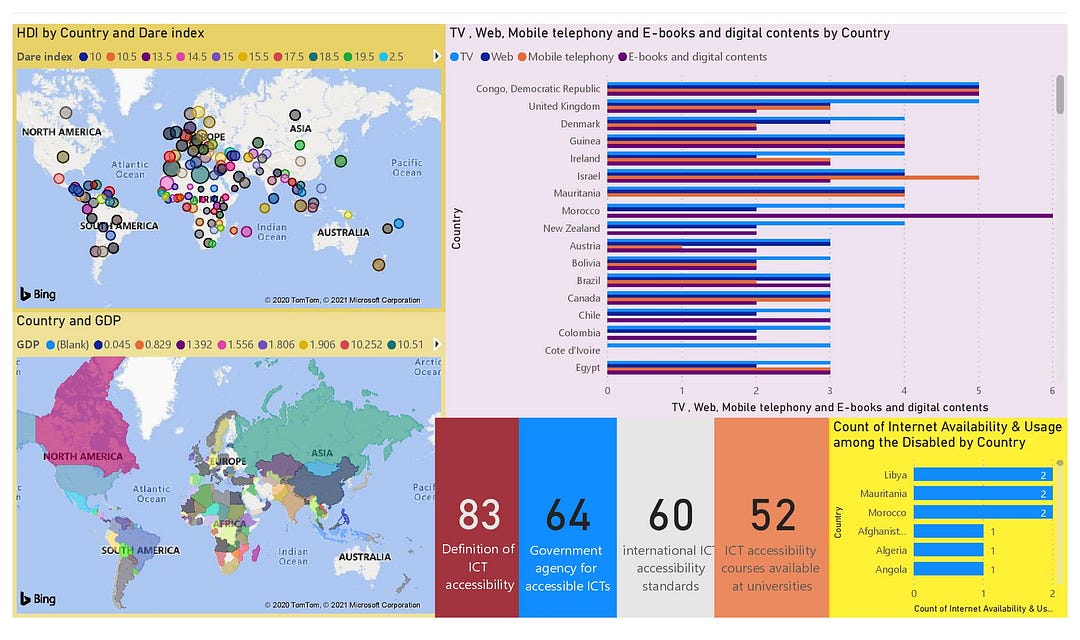
Finding a dataset pertaining to disability and connectivity was one of the most complex tasks. After spending significant time in the literature review, the team eventually found a dataset that could be used for further processing. The data accumulation was from the G3ict: The Global Initiative for Inclusive ICTs, whose mission is to promote the Rights of Persons with Disabilities in the Digital Age. The Digital Accessibility Rights Evaluation (DARE) Index 2020 score includes points corresponding to the three categories of variables measured: country commitments, capacity to implement, and actual outcomes in digital accessibility for persons with disabilities. It indicates the overall progress and momentum of a country in implementing digital accessibility as per the ICT accessibility dispositions of the Convention on the Rights of Persons with Disabilities. These measures were used to predict the target variables of HDI and GDP. Data visualization was done using Power BI and Tableau.
Power BI dashboard / Source: Omdena
Results
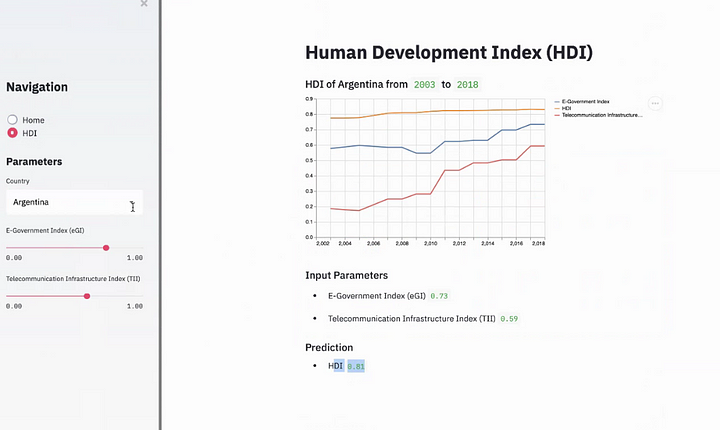
The successful collaborative effort from all the task groups was combined by building a web-based dashboard using Streamlit, an open-source python library. Streamlit library has the ability to render dynamic dashboards that can be updated in real-time. The models that were built during the course of the project were deployed on this dashboard in order to make real-time predictions as well as adjust with updated data.
Dashboard for tracking change in HDI / Source: Omdena


