
A Brief Approach to Data Analysis in Healthcare
June 2, 2022

The premise for this article is based on the data analysis done for a healthcare app.
Introduction
In this article, we would like to summarize the steps that were taken to perform the data analysis and data munging for this project. This includes the understanding of the medical data and the thought process behind various decisions made during the course of the project.
As we know, data is a collection of information that organizations can use to make important decisions on a day-to-day basis. Data can be analyzed and visualized as graphs, tables, or images.
What is data in healthcare and why is it important?
Healthcare data is any data related to health conditions, causes of illness, quality of life, medications, tests, etc., for an individual or population. Healthcare data includes clinical metrics along with environmental, socio-economic, and behavioral information pertinent to health and wellness.

Healthcare is a dynamic industry that implements the latest technologies and there is a huge potential for more accurate and complete patient data collection. Good quality patient data is essential to provide the right treatment and support for the patients and keep them informed about the progress. Patients looking at their own health data gain insight into how their health is evolving over time.
It’s mind-boggling to think about the amount of data produced in the healthcare industry on a daily basis, which is illustrated in the figure below, showing how the data has been increasing over the years.

For all this massive amount of data to be functional, it needs to be processed, stored, and analyzed. Some of the other reasons why medical data is important are:
- Market competitiveness
- Making well-informed decisions
- Implementation of AI
- Reduction of costs
- Storage of all data in one place
- Future outbreak prevention
How is data collected in healthcare?
Questionnaires, observations, and document examinations are all examples of some of the common healthcare data collection techniques. Today, most information is collected through digital channels and a collection of healthcare apps available in the market. The FDA believes, however, that mobile apps may be beneficial in helping people to improve healthy habits, motivating positive changes to boost well-being, and accessing useful health-related information more readily.

This article is based on a medical app dedicated to helping people with Hashimoto’s disease with the long term goal of helping to manage their thyroid condition.
As we know, Hashimoto’s disease is an autoimmune disorder affecting the thyroid gland. Although it centers around the thyroid gland, it affects the entire body. Hashimoto’s and other frequent autoimmune diseases are incurable and hard to treat.
The app uses the questionnaire method of data collection. When a user registers to their app, the user is taken through a series of questions related to the general well-being, as well as, specific thyroid and Hashimoto’s related questions. Along with this, other information like triggers, symptoms, and hormones is also collected.

Database in the area of healthcare, in general
Every medical app has a database to store all the information collected from their users. There are two types of databases generally used by healthcare entities. These are primary and secondary databases.
1. The Primary Database
The primary database is the one that is built directly by the healthcare organization and is made available to all the related medical professionals.
2. The Secondary Database
The secondary database is made up of various healthcare organizations that provide clinical information for entities, such as hospitals, clinics, physician groups, and insurance companies.
Among the primary databases, the most commonly used type of databases are :
- Hierarchical database
- Network databases
- Relational databases
- Object-oriented database
- Graph database
- ER model databases
- Document databases
- NoSQL databases
Database
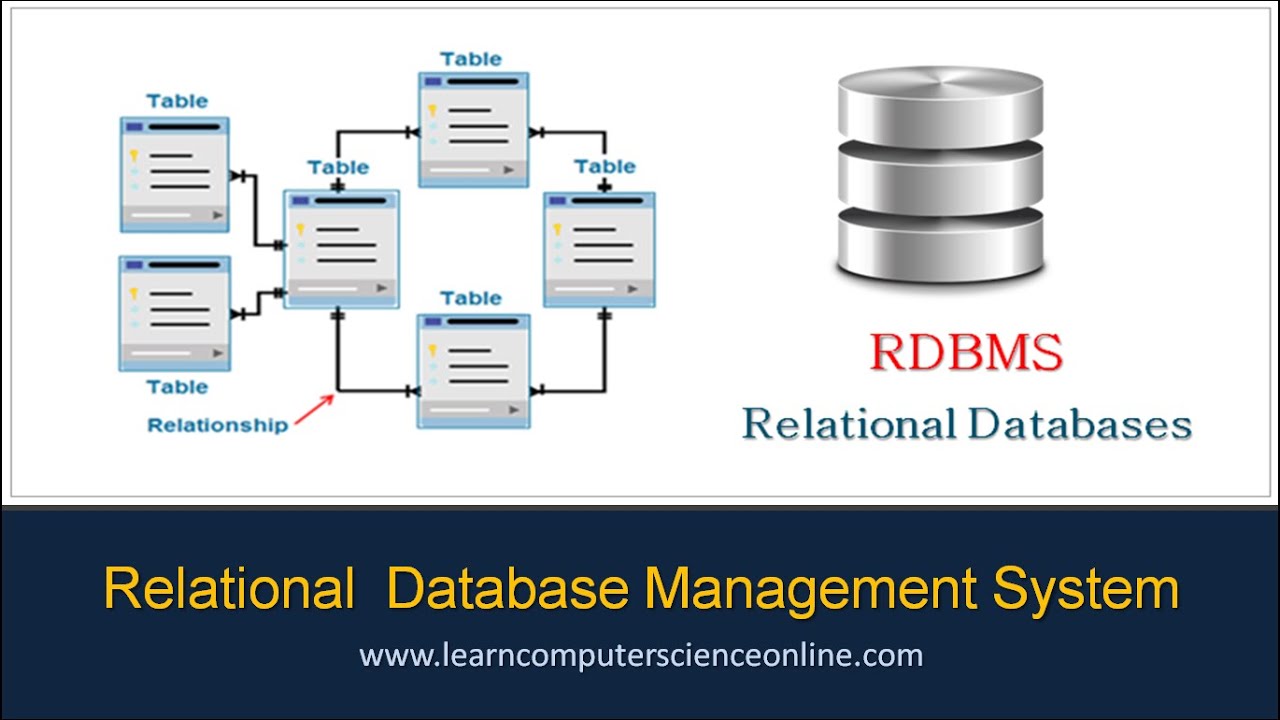
In this instance, we used BigQuery as the database, which falls into the category of the relational database. From here on, the article focuses on data analysis and data munging, with the final goal of having a unified dataset.

Understanding the relational database can be quite challenging when the domain is new and thereby having to allocate more time for this phase. This in turn helps us in finding out the gaps, missing information, and any other abnormalities/outliers.
Data Analysis
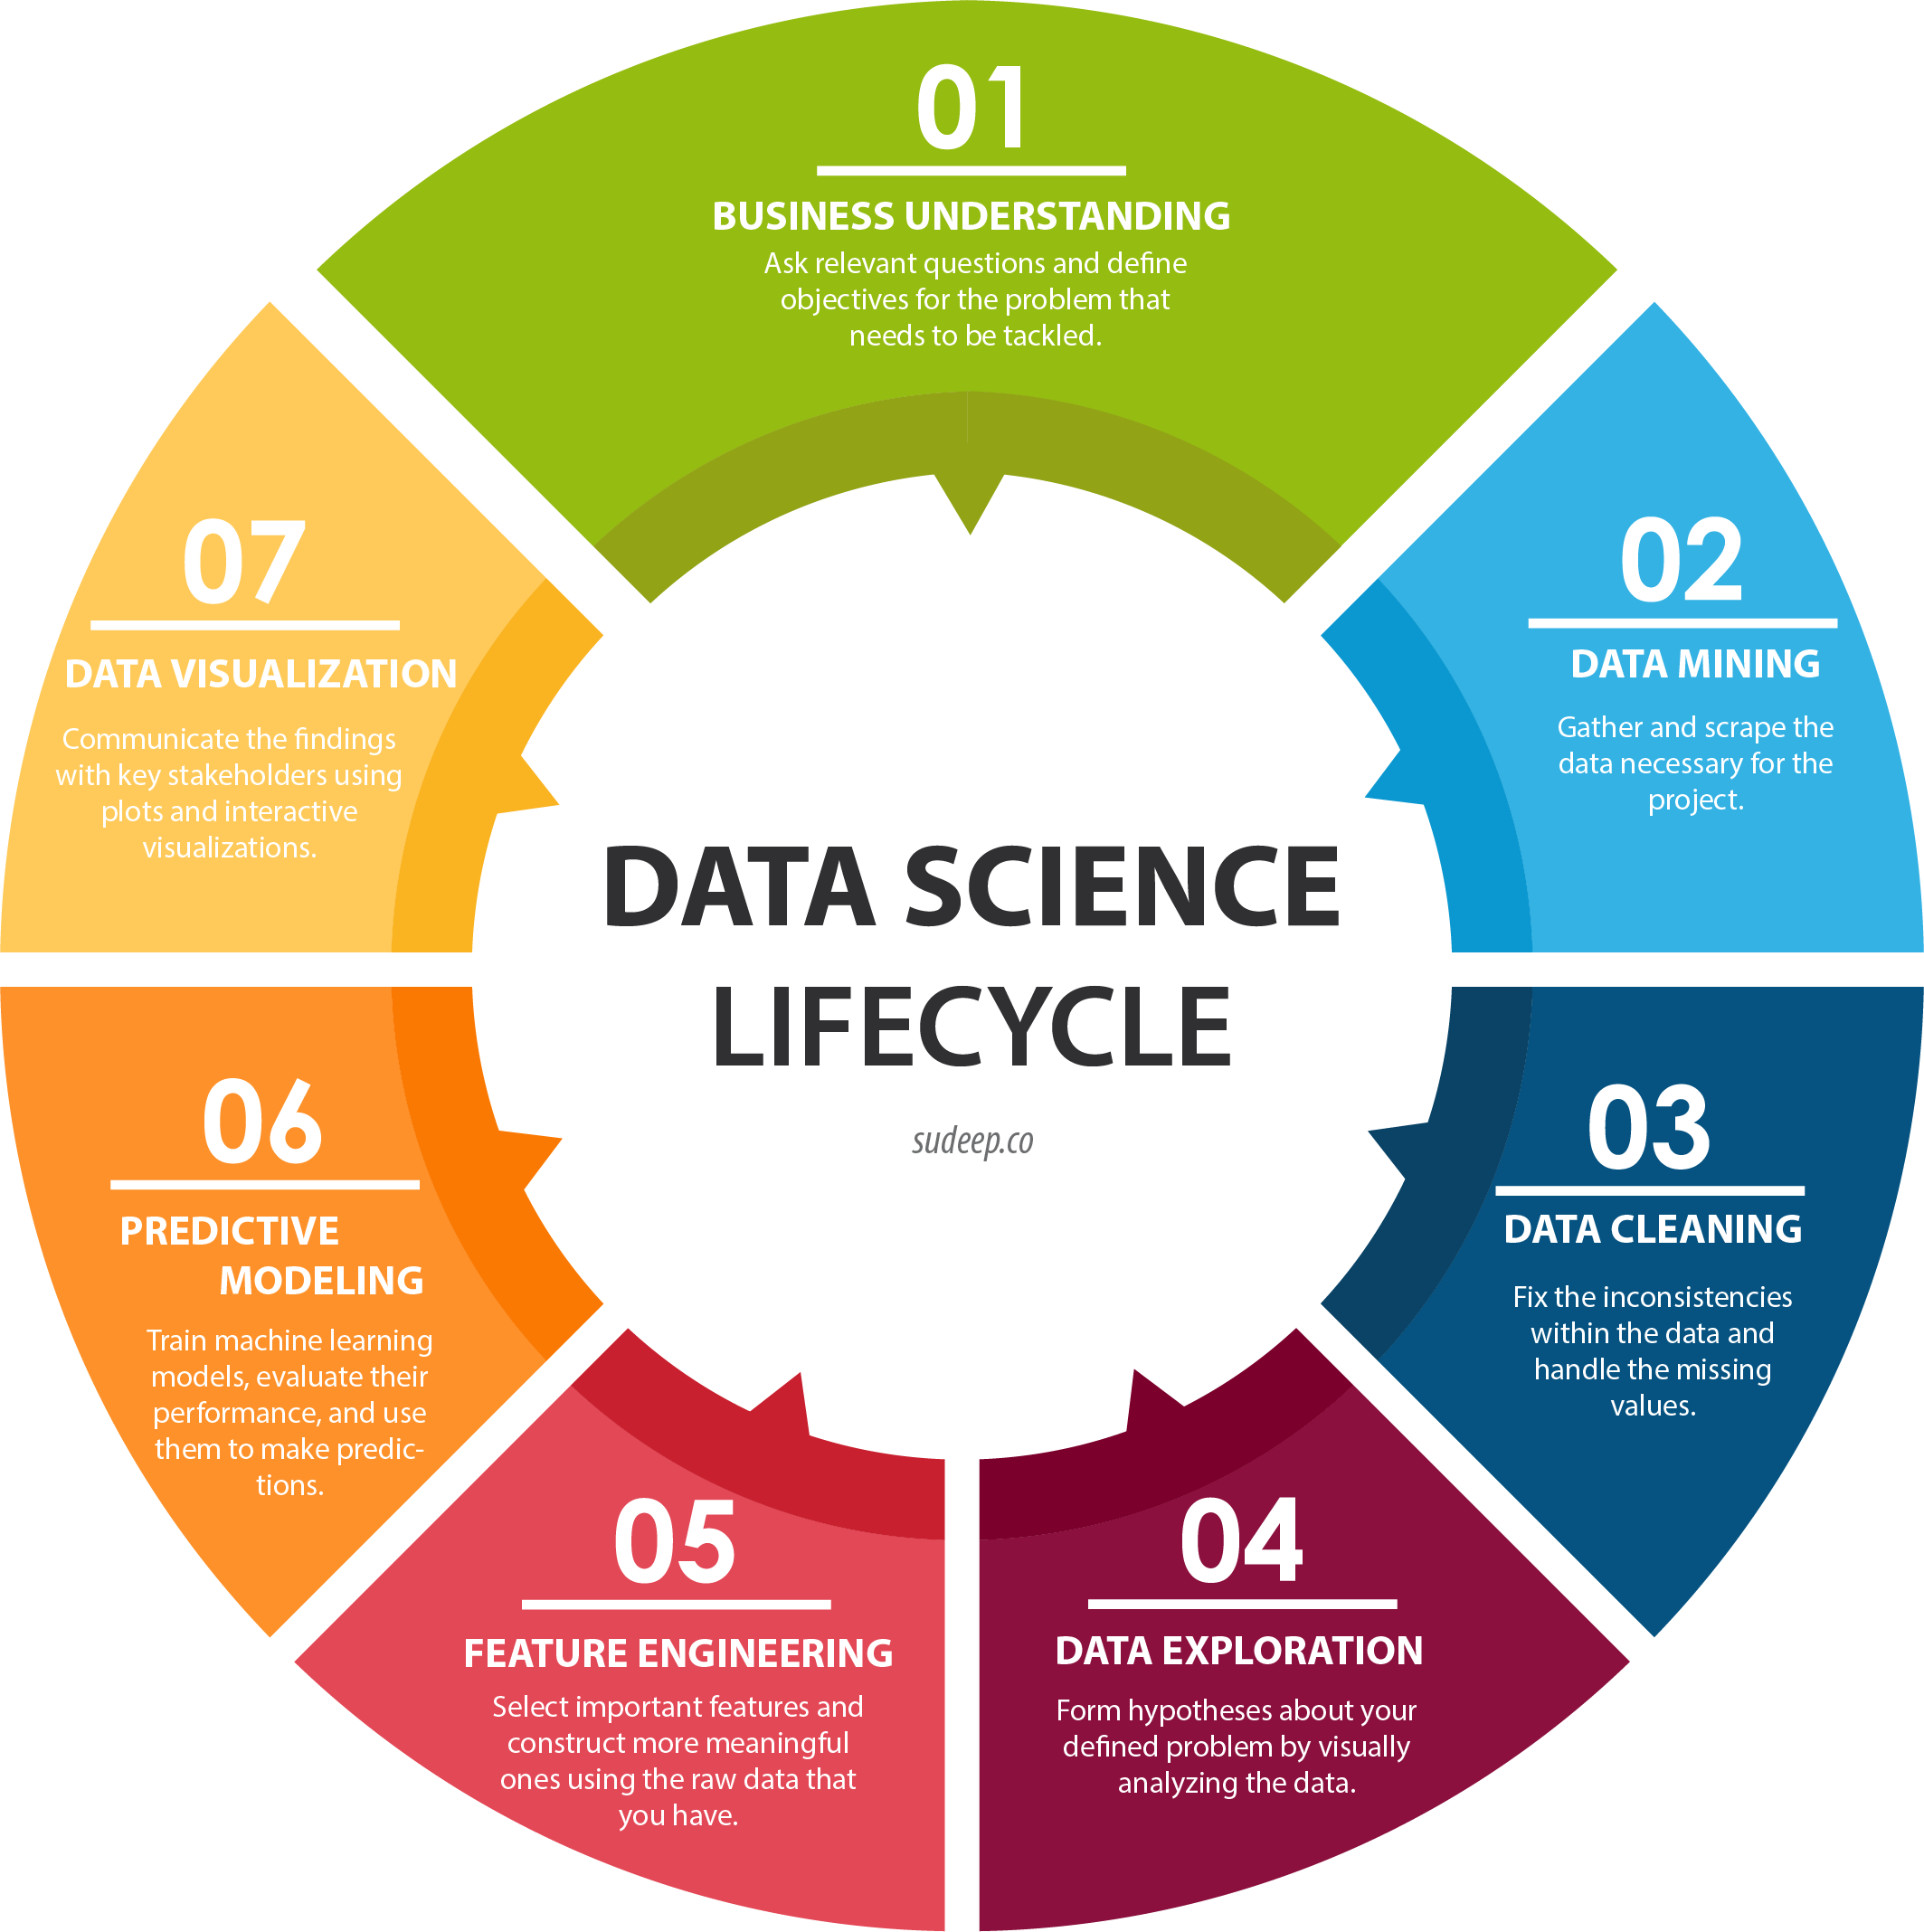
For any Data Science project, the common process flow is as shown in the figure below:

But this might not be applicable to all the business use cases. Based on a particular use case, decisions need to be made in redesigning the process flow and the approach towards achieving the end results.
The rest of the article will focus on steps taken to understand the data better and come up with meaningful analysis.
The objective of the analysis
The main objective of the project was to find the correlation between triggers, symptoms, and any comorbidity, among the users of the app. The nature of the data is a one-to-many relationship, meaning each user will have many records pertaining to the questions they have answered.
Phases of the analysis
In this context, even though the data was provided to us, the challenge was to understand the meaning of each field for a specific table and the corresponding source of that data(ground truth) from the app.
This evolved into two phases:
1. Analysis of the database tables
2. Analysis of the app flow
In reality, we might have to spend more time analyzing and cleaning the data, than we would spend creating the ML models and deployment.
Especially in the healthcare domain, unclean and incorrect data can lead to wrong results and thereby, affect the treatment as well.
The process flow diagram below shows the various phases of how the information from the app is reconciled with the data in the database, to achieve a unified dataset, as the final data source.

Image created using Powerpoint
Execution pathway:
- Analysis of the data tables – The initial analysis of the source data is done, involving the following steps:
- Understanding the data fields
- Relationships among various features within a table
- Relationship between different tables
- Identify any relationship gaps
- Analysis of the app screens – After the above step:
- Analysis of app screens
- Understanding connectivity between app fields and data
- Identifying the gaps between app and data
- Data cleaning and processing – With the know-how of the information in the app:
- Data cleaning and data munging
- Handling missing information
- Removing duplicate information
- Modifying invalid data types and values
- Introducing new relationships in the data
- Preparation of final dataset – With the cleaned data, we proceeded to prepare the final dataset by combining the information required for the analysis.
- Analysis of final dataset – We performed statistical analysis and visualizations to get a better understanding of the data and to see if it satisfies the business use case.
Caveat: The preparation of the final dataset is specific to this particular project. It will differ depending on the business use case.
Conclusion
For any healthcare app, the most challenging aspect is that the users are not willing to provide all the key information that might be required for the purpose of serving them in a better way. Through this analysis of the data pertaining to the app, all possible gaps can be identified, which will help in making improvements and key decisions.
This article is written by authors: Pankaja Shankar, Archana Nallam.
You might also like


