Modeling Triggers and Symptoms of Hashimoto’s Disease

An Omdena team of 30 AI changemakers collaborated with the rising impact startup Hashiona to better understand the relationship between triggers and symptoms of Hashimoto’s disease. The team extracted user data from Hashiona´s app, consolidated the data, did extensive data exploration, and applied statistical analysis and clustering models on triggers and symptoms for Hashimoto’s disease. The models were deployed and visualized in a Streamlit app.
Results from this project are intended to be used in Hashimoto´s app to help the user cope better with Hashimoto´s disease.
The problem
Hashimoto’s disease is an autoimmune disorder that causes hypothyroidism. Hashimoto’s and other frequent autoimmune diseases are incurable and hard to treat. Hashimoto’s is described with at least 45 medical symptoms, which are hard to detect. Exactly as in the treatment of diabetes, patients have to implement comprehensive lifestyle changes to mitigate the autoimmune response in their body & feel better (i.e. go into remission). Patients with Hashimoto’s disease may experience persisting symptoms despite normal hormone levels.
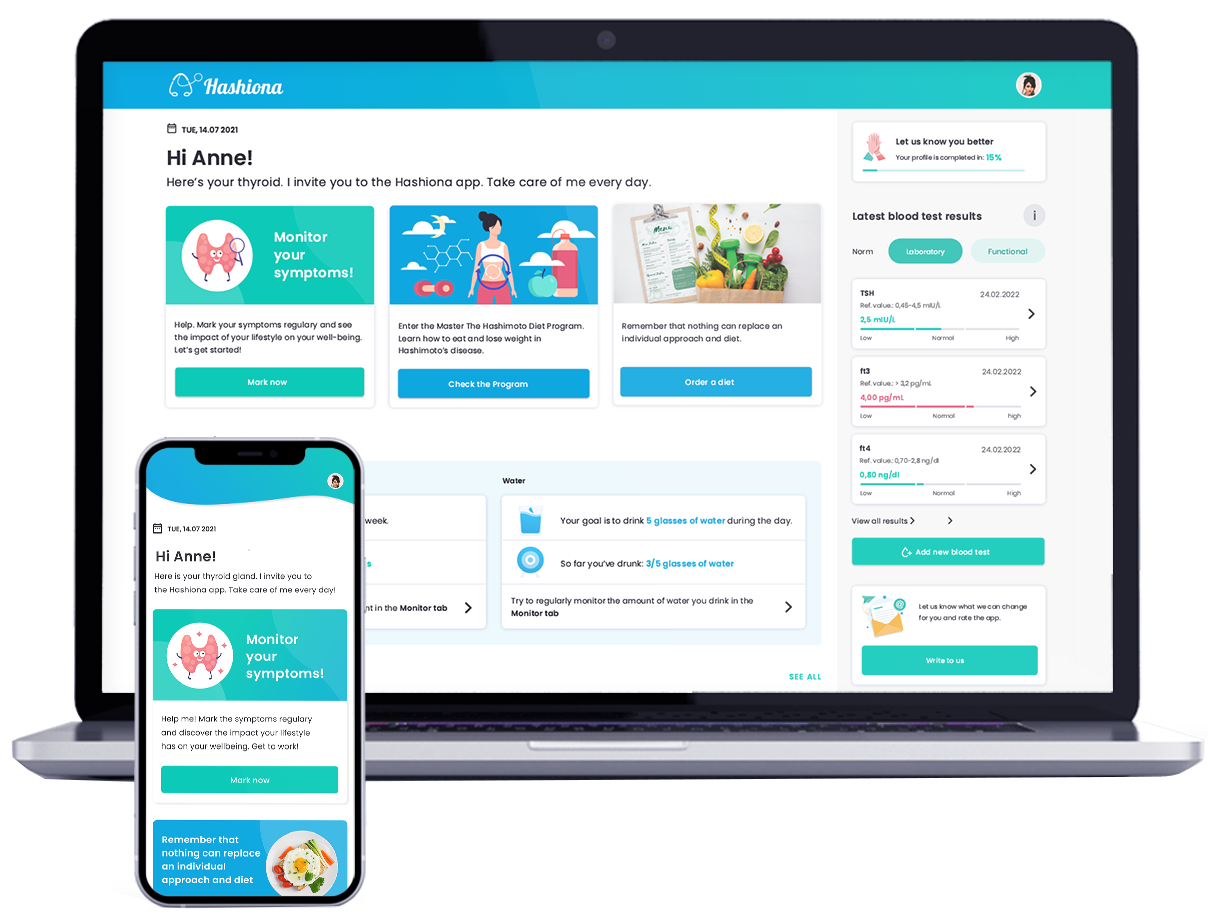
Hashiona is the first mobile application dedicated to people with Hashimoto’s disease and/or hypothyroidism. Hashiona´s user base exceeds 10,000 and their approach has been validated by Stanford, Draper University, MIT, and more.

Source: Hashiona
The project outcomes
The data
The first step was to apply Exploratory Data Analysis (EDA) to discover the hidden patterns and anomalies in the entire dataset. Next, the team divided the data into subsets for analysis:
- Profiles who suffer from Hashimoto
- Profiles who suffer from Thyroidism
- Profiles with Thyroidism symptoms
- Profiles having any triggers, mind or body symptoms
Next, top triggers and symptoms were identified. Examples include:
- Overtraining
- Cold
- Caffeine consumption
- Relationship with family
- Heat
The team identified user profiles who either suffer from Hashimoto’s or Thyroidism and have recorded their hypothyroidism symptoms. Among these profiles, correlation analysis was performed for body symptoms, mind symptoms, and thyroid symptoms with triggers.
Next, clustering analysis and modeling have been applied to show the most occurring triggers for various clusters. After grouping data by cluster, the average population in the cluster affected by a trigger or symptom was calculated.
The models and dashboard
To visualize the models and outcome the team choose Streamlit. Streamlit allows users to quickly build highly interactive web applications and is generally used for deploying Machine learning models.
For the demo, static charts have been implemented.

Screenshot: Streamlit Dashboard
First Omdena Project?
Join the Omdena community to make a real-world impact and develop your career
Build a global network and get mentoring support
Earn money through paid gigs and access many more opportunities
Your benefits
Address a significant real-world problem with your skills
Access paid projects, speaking gigs, and writing opportunities
Good English
A very good grasp in computer science and/or mathematics
Student, (aspiring) data scientist, (senior) ML engineer, data engineer, or domain expert (no need for AI expertise)
Programming experience with Python
Understanding of Data Analysis and Machine Learning.
This challenge has been hosted with our friends at
Application Form


Become an Omdena Collaborator


