Building an Elevation Map For Forest Cover using Deep Learning
Building elevation and typographical map for forest cover using Deep Learning to prevent fires sparked from falling trees.

The Problem: How to build an Elevation Map?
Now, how do we get to the elevation map? And what do we use it for?
Those were the main questions we asked ourselves, considering that we will be doing something great for the world in this project regarding the understanding of topographical maps using deep learning.
First, what is an Elevation Map anyway?

What is an Elevation Map
An elevation map shows the various elevations in a region. Elevation in maps is shown using contour lines (level curves), bands of the same color (using imagery processing), or by numerical values giving the exact elevation details. Elevation maps are generally known as Topographical Maps by using Deep Learning.
The Solution: Generating Elevation Maps

Diagram of Elevation Map Process
What needs to be created?
- A Digital Elevation Model (DEM).

Digital Elevation Model (example)
A digital Elevation Model is a specialized database that represents the relief of a surface between points of known elevation. It is the digital representation of the land surface elevation.
- Level Curves (contour line).

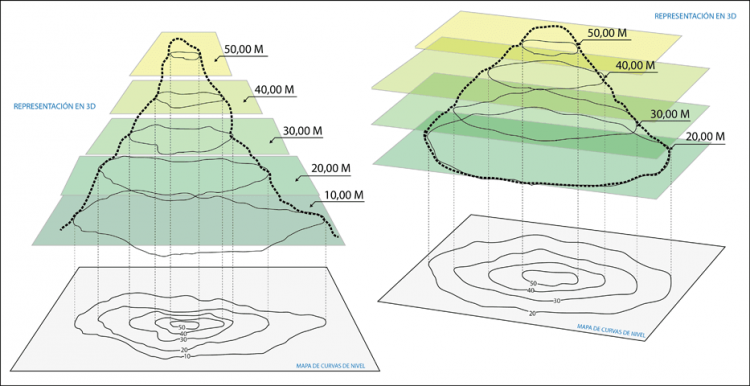
Contour lines are the most common method of showing relief and elevation on a standard topographical map using deep learning. A contour line represents an imaginary line of the ground, above or below sea level. Contour lines form circles (or go off the map). The inside of the circle is the top of a hill.
We worked with the DEM to create the contour lines, using GIS open-source software, in this case, we used a GIS software called QGIS with a plugin’ called “Contour”, which uses the elevations of the DEM to define the level curves and obtain a contour line model of the study area (it is possible to define the distance between each level curve, which in this case occurred every two meters).

DEM converted into Contours.
- Triangulated Irregular Network (TIN).

Next, we need a Triangular Irregular Network (TIN) with vector-based lines and three-dimensional coordinates (x,y,z). The TIN model represents a surface as a set of contiguous, non-overlapping triangles.
We applied computational geometry (Delaunay Triangulation) to create the TIN.
Delaunay triangulations are widely used in scientific computing in many diverse applications. While there are numerous algorithms for computing triangulations, it is the favorable geometric properties of the Delaunay triangulation that make it so useful.
For modeling terrain or other objects with a set of sample points, the Delaunay Triangulation gives a good set of triangles to use as polygons in the model. In particular, the Delaunay Triangulation avoids narrow triangles (as they have large circumcircles compared to their area).
- Digital Terrain Model (DTM).

A DTM is a vector dataset composed of regularly spaced points and natural features such as ridges and break lines. A DTM augments a DEM by including linear features of the bare earth terrain.
DTM’s are typically created through stereophotogrammetry, but in this case, we downloaded a point surface of the terrain.
The points are called LiDAR points, a collection of points that represents a 3D shape or feature. Each point has its own set of X, Y, and Z coordinates and in some cases additional attributes. We can think about a point cloud as a collection of multiple points and converted into a DTM using GIS open-source software.
The Results
After applying previous techniques in the context of identifying trees, we got the following results.
- Our Digital Elevation Model

Digital Elevation Model of the Study Area
- The Contour Lines

Level Curves of the Study Area
- Our Triangulated Irregular Network

TIN of the Study Area
- The Digital Terrain Model

DTM of the Study Area
These results are part of an overal solution to identify trees close to power stations and allows us to find and determine the elevations of the forest cover, as well as the aspect of the land, either for geological purposes (determination of land use), forestry (control of protected natural areas), or to prevent fires in high-risk areas (anthropic causes).
The elevation map can give great help to public agencies to perform spatial analysis, manage large amounts of spatial data, and produce cartographically appealing maps to aid in decision making. It improves the responders efficiency and performance by giving them rapid access to critical data during an incident.
This article is written by Gabriel Garcia.
You might also like


