A Colombian last-mile logistics company handling 200,000+ deliveries per month across Latin America lacked a routing system capable of enforcing real-world constraints at city scale. Omdena assembled 50 AI engineers to build a route optimization system using Google OR-Tools, OpenStreetMap geospatial data, and a custom graph algorithm on Bogotá’s directed road network. Over ten weeks, the team delivered a production-ready Flask API on AWS that demonstrated a 10% reduction in delivery times, a 5% reduction in delivery costs, and a 20% improvement in customer satisfaction.
Key Outcomes
Outcome
Detail
Delivery time reduction
10% demonstrated post-deployment
Delivery cost reduction
5% through fewer vehicle miles traveled
Customer satisfaction
20% increase post-deployment
GHG emission reduction
Up to 15% per route via efficiency gains
Road network modeled
335,590 edges, 153,164 nodes (Bogotá)
OSM restrictions applied
92% of extracted turn restrictions incorporated
Client scale
200,000+ deliveries/month; target 1 million/month in 2022
Project team
50 AI engineers, 10 weeks (January–April 2022)
The Problem: No Scalable Routing System for 200,000 Monthly Deliveries
The client processed more than 200,000 deliveries per month across Bogotá, Lima, Mexico City, and Rio de Janeiro (four of the world’s most congested urban environments) and was targeting one million per month by 2022. Without a system capable of handling real-world routing constraints at that scale, dispatch remained manual and inefficient, capping growth and inflating costs.
The core constraint was technical. the client’s operations required routing across Bogotá’s one-way street grid with turn restrictions, time windows, vehicle capacity limits, and service priorities all applied simultaneously. No off-the-shelf routing tool handled all these constraints in a single optimization pass. Inefficient routes also carried a direct environmental cost: unnecessary vehicle miles increased fuel consumption and GHG emissions across every delivery run.
The Partnership: Omdena and a Colombian Last-Mile Logistics Provider
The client joined Omdena’s incubator for impact startups in 2021. Omdena assembled 50 AI engineers from around the world for a ten-week sprint from January to April 2022. the client provided two proprietary datasets for Bogotá: a Shapefile with road geometry, direction, and average speeds; and an OpenStreetMap (OSM) file covering the city’s turn restrictions.
Why Route Optimization Is Hard: Six Constraints and Combinatorial Scale
The Vehicle Routing Problem (VRP) grows exponentially in solution complexity as delivery constraints are added. the client’s operations required enforcing six constraints simultaneously on every route:
Vehicle capacity: each vehicle has a maximum load limit that cannot be exceeded.
Time windows: each delivery stop has a customer-specified window for arrival.
Service duration: time spent at each stop for handoff and signature.
Pickup and delivery: some jobs require collecting an item before dropping it elsewhere.
Vehicle start and end: vehicles depart from and return to a defined depot.
Visit priority: penalty weights for dropped visits when not all stops can be served.
At city scale, finding the provably optimal VRP solution is computationally intractable — it could take years for a large instance. Any practical routing system must return a near-optimal solution within a short time bound using heuristic search. Bogotá’s one-way street grid added further complexity: the nearest drivable node to a delivery address is not always the correct approach, and standard pathfinding algorithms have no native mechanism for OSM turn restrictions.
Building the Route Optimization System: Graph Algorithms, OR-Tools, and a Custom A* Implementation
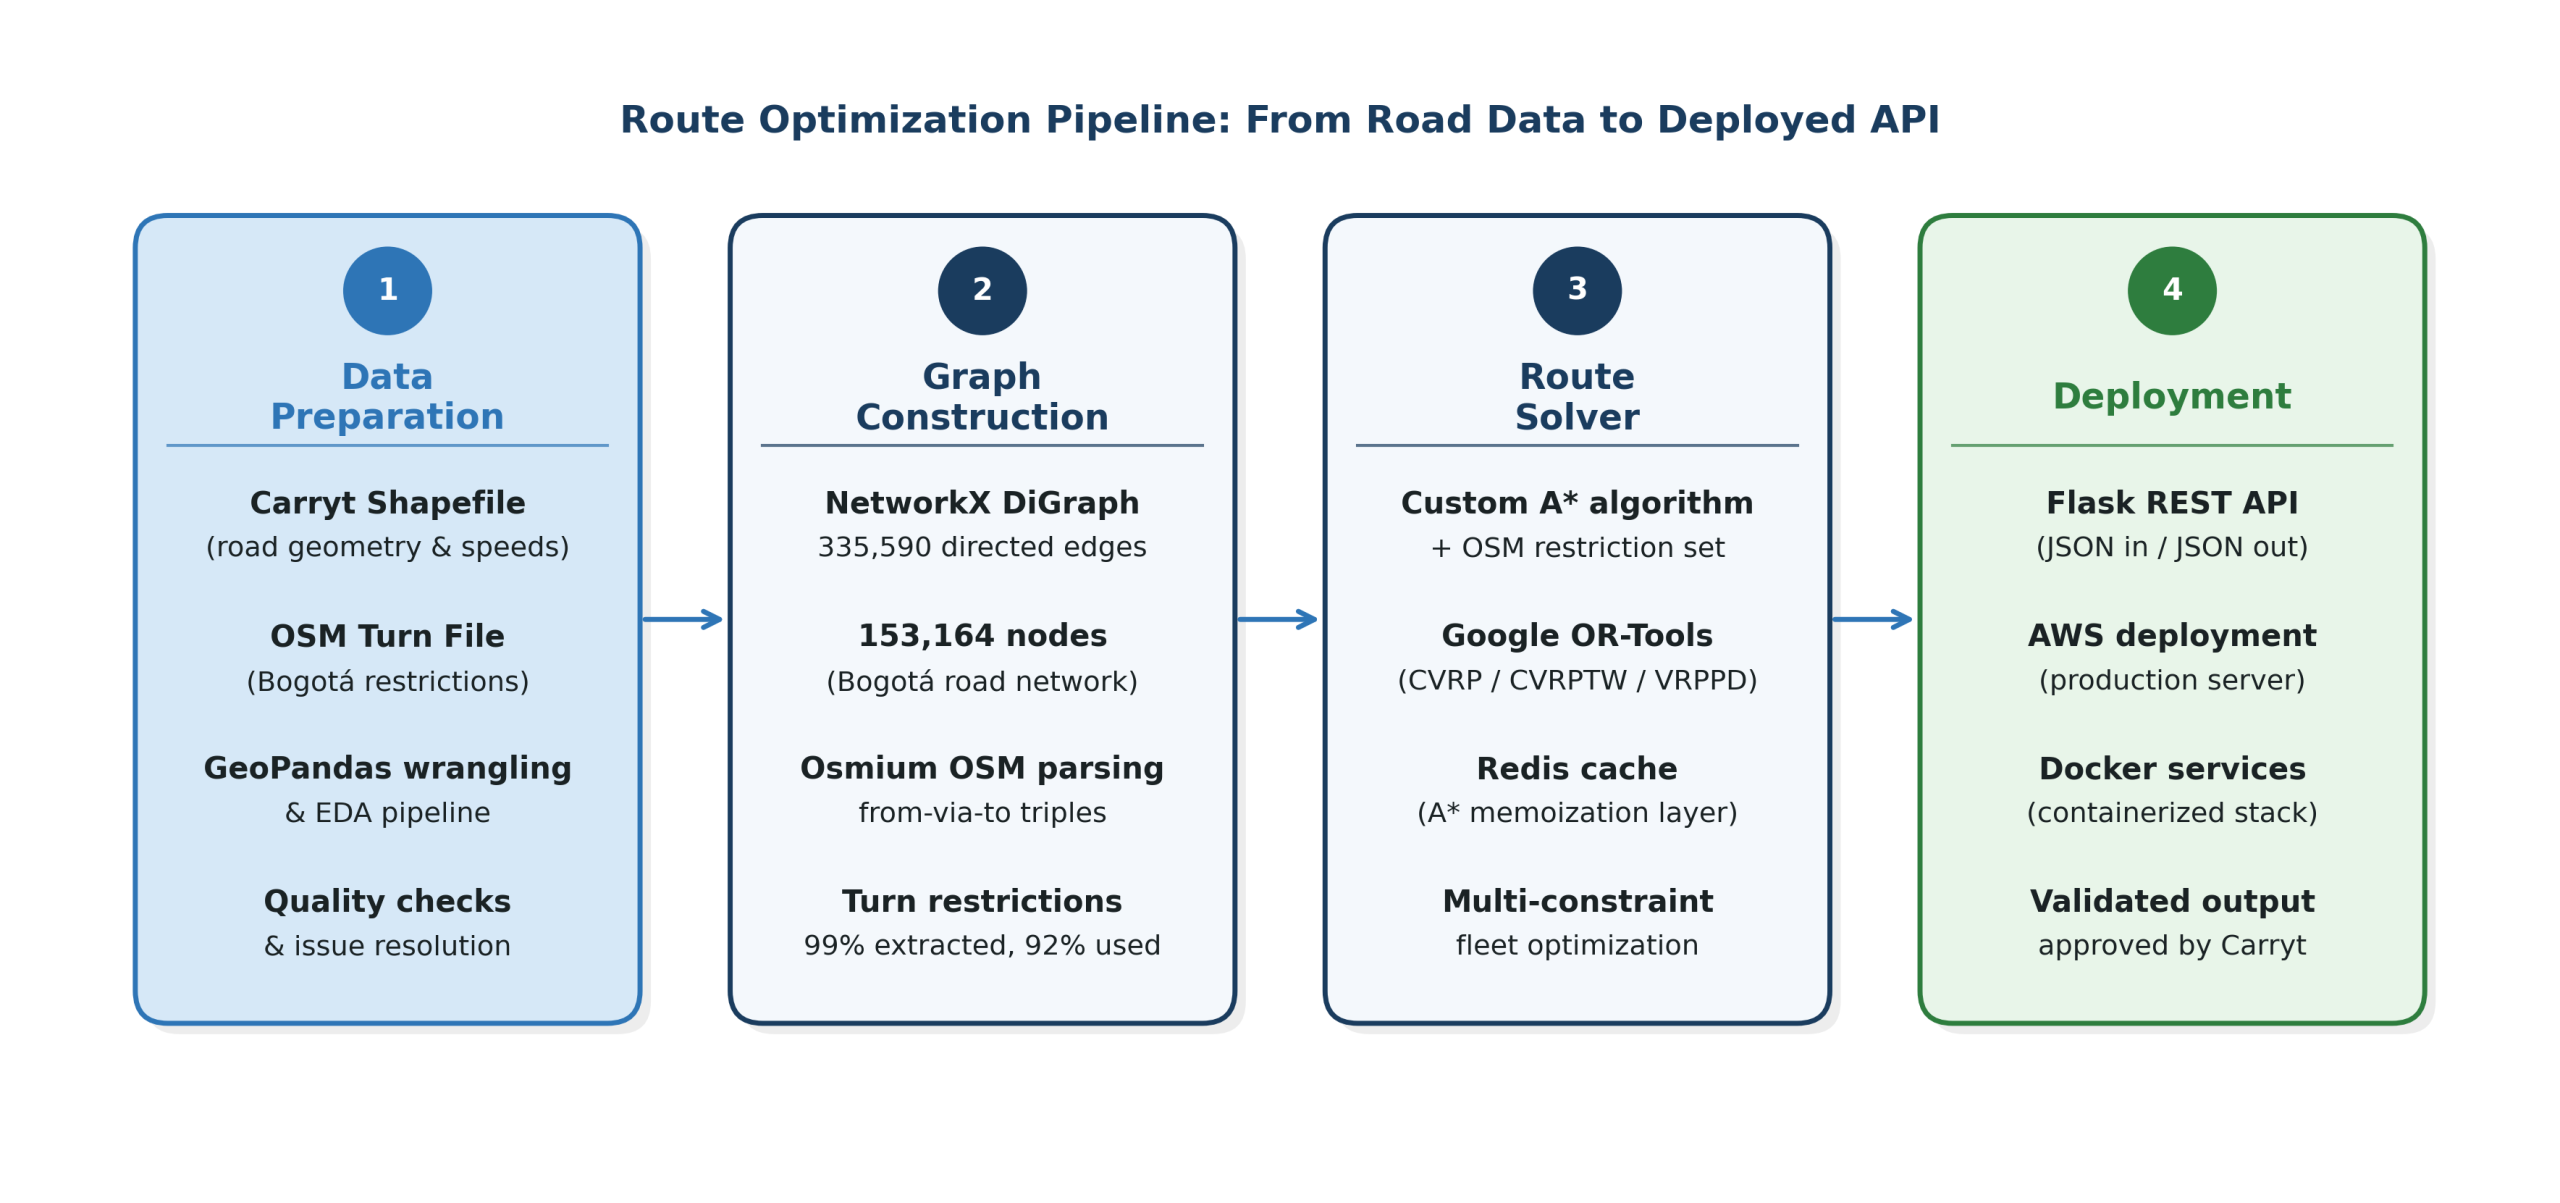
Figure 1: The four-stage route optimization pipeline, from raw geospatial data to the deployed AWS API. Image source: Omdena.
Step 1 — City Map Construction
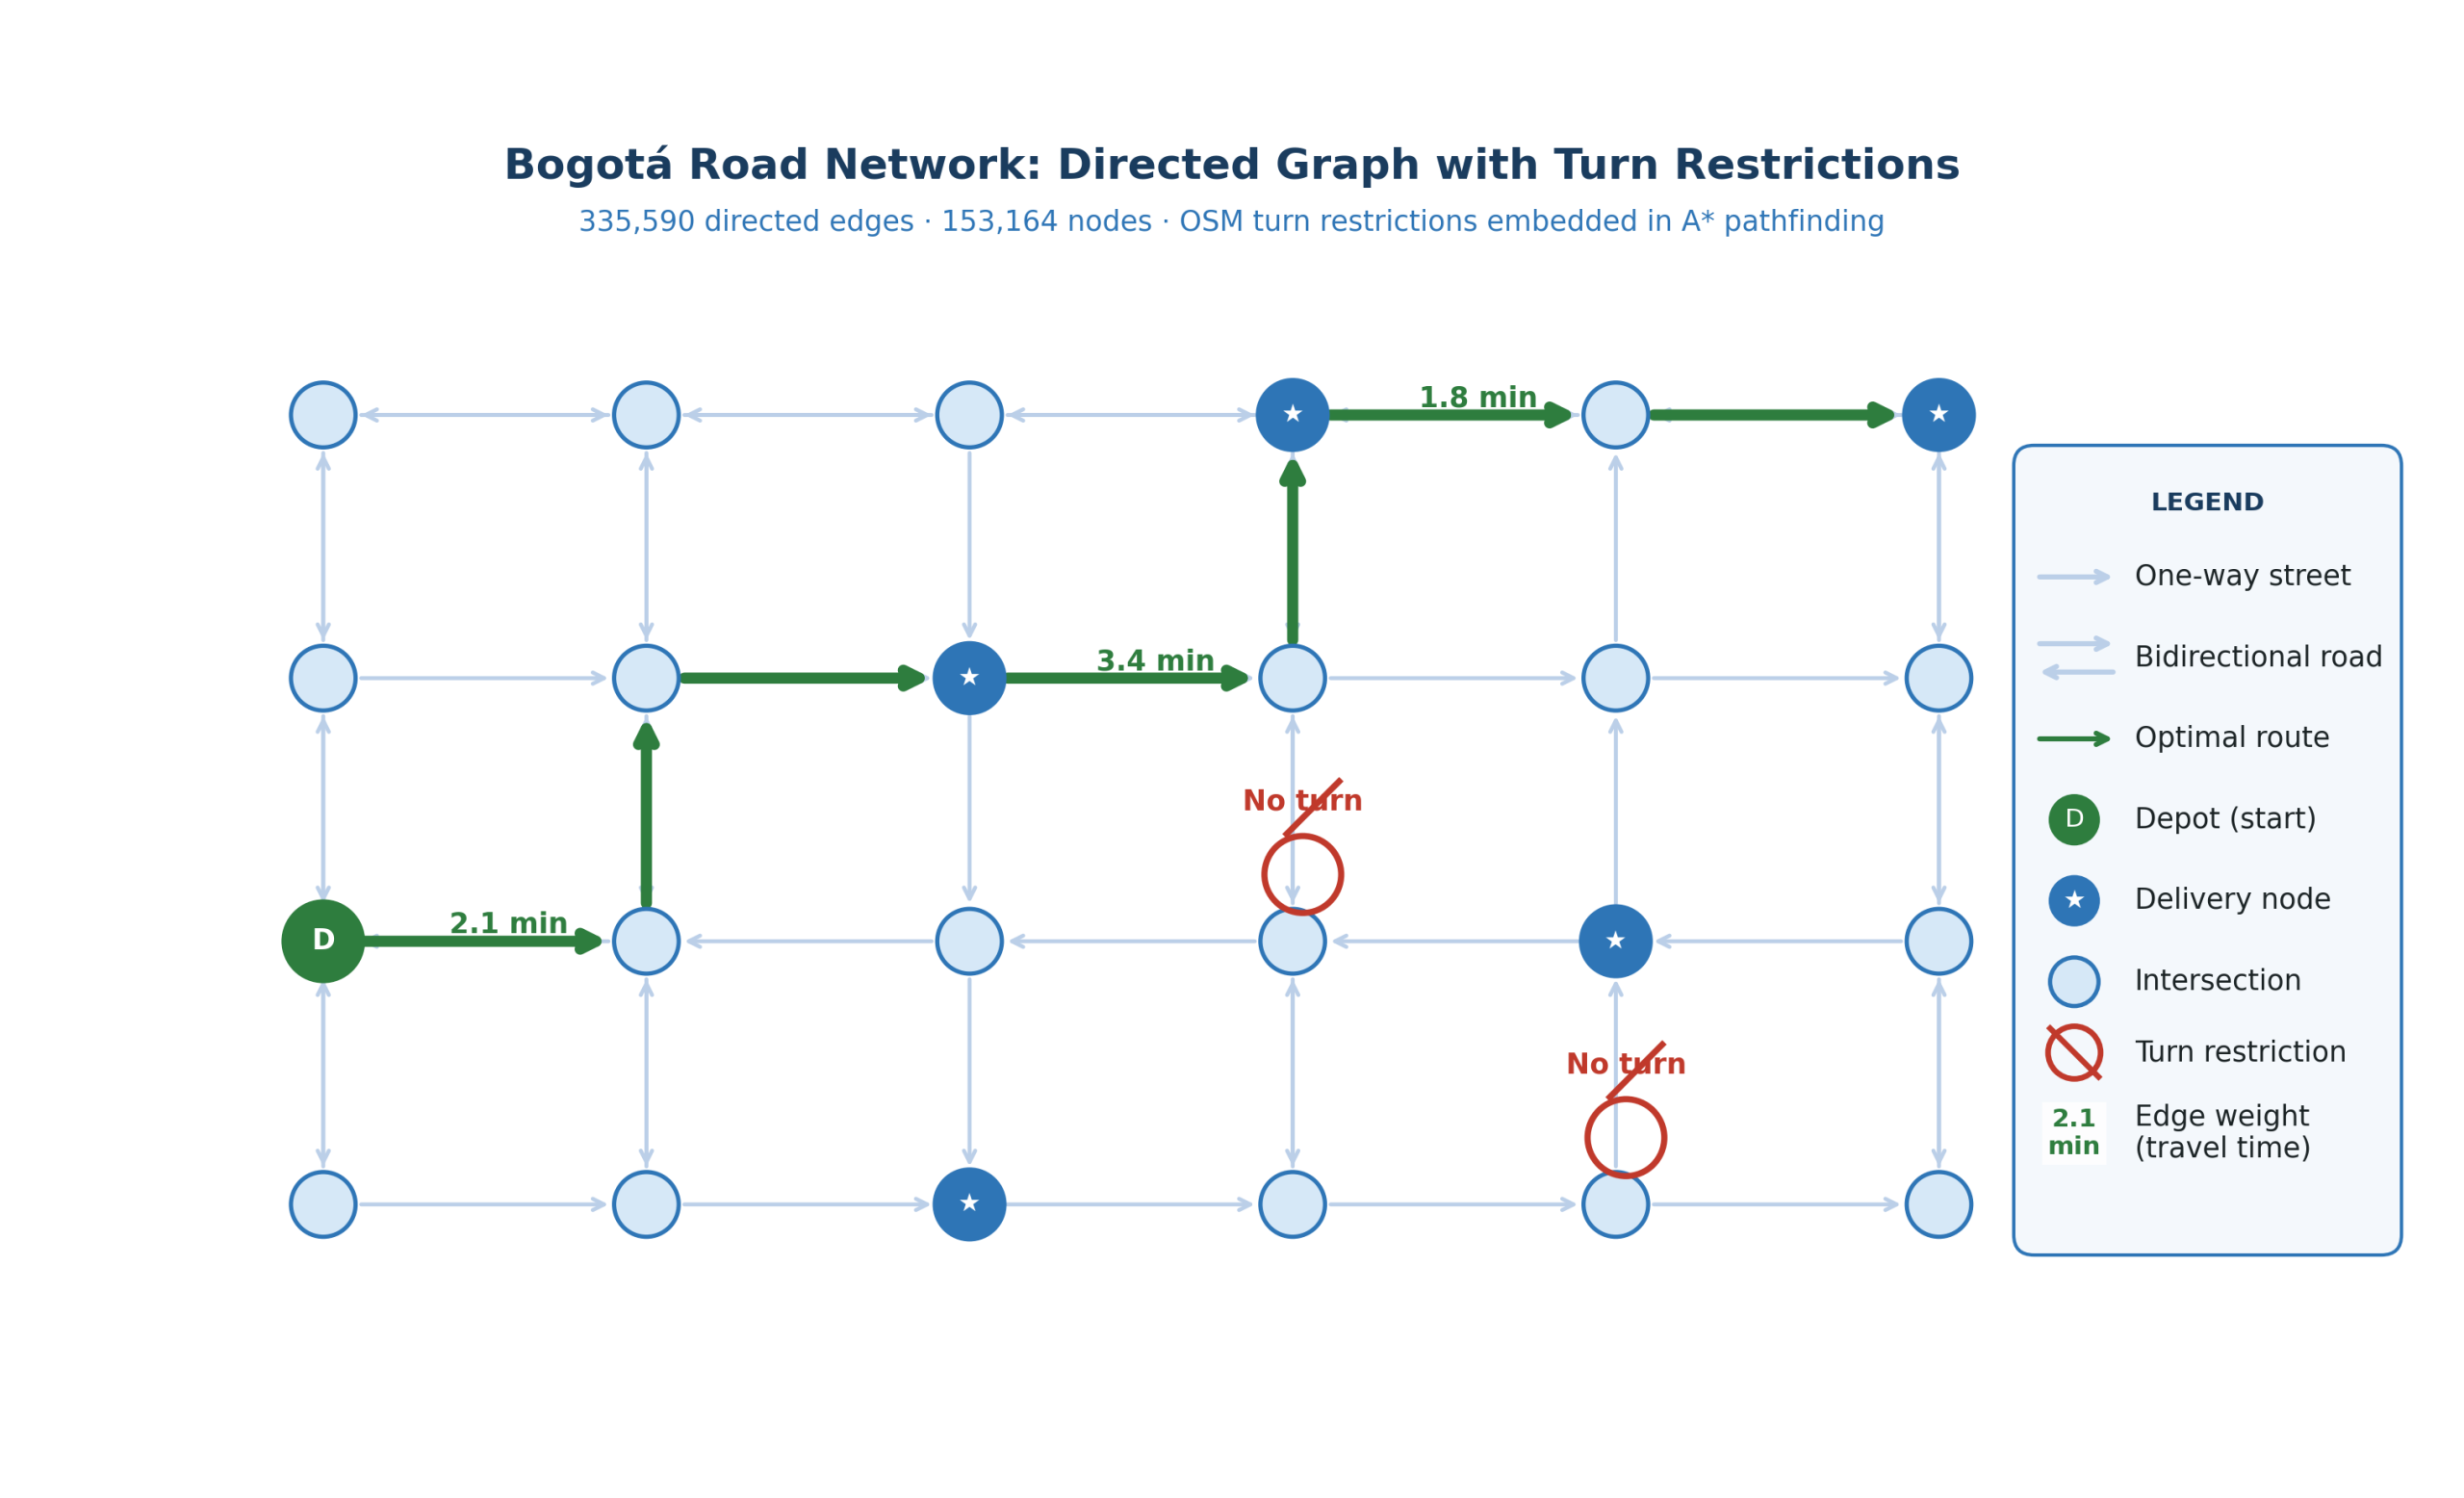
The Shapefile was parsed with GeoPandas into a structured dataframe, with travel-time weights calculated as distance divided by average speed. The road network was modeled as a directed graph using NetworkX: one-way streets became single directed edges, bidirectional roads became two. The resulting graph contained 335,590 directed edges and 153,164 nodes.
Figure 2: Bogotá’s road network as a directed graph — one-way streets, turn restrictions, and a sample optimized route with travel-time edge weights. Image source: Omdena.
Step 2 — Turn Restriction Encoding
OSM restrictions (no-left-turn, no-U-turn, and similar prohibitions) were extracted using Osmium as from-via-to node triples. Of all restrictions in the OSM file, 99% were successfully extracted and 92% incorporated into the routing model. The team modified the standard NetworkX A* implementation to track edge costs rather than node costs, enabling turn restrictions to be checked at every candidate move during route search without removing road segments from the graph.
Step 3 — Nearest-Edge Correction and Redis Caching
On Bogotá’s one-way network, routing to the nearest node could systematically underestimate delivery time when the correct approach required additional blocks. The team resolved this by temporarily inserting a routing node on the nearest edge rather than the nearest intersection, correcting geometry for any arbitrary delivery location. A Redis in-memory cache stored completed A* paths, avoiding redundant computation for recurring source-destination pairs.
Step 4 — OR-Tools VRP Solver
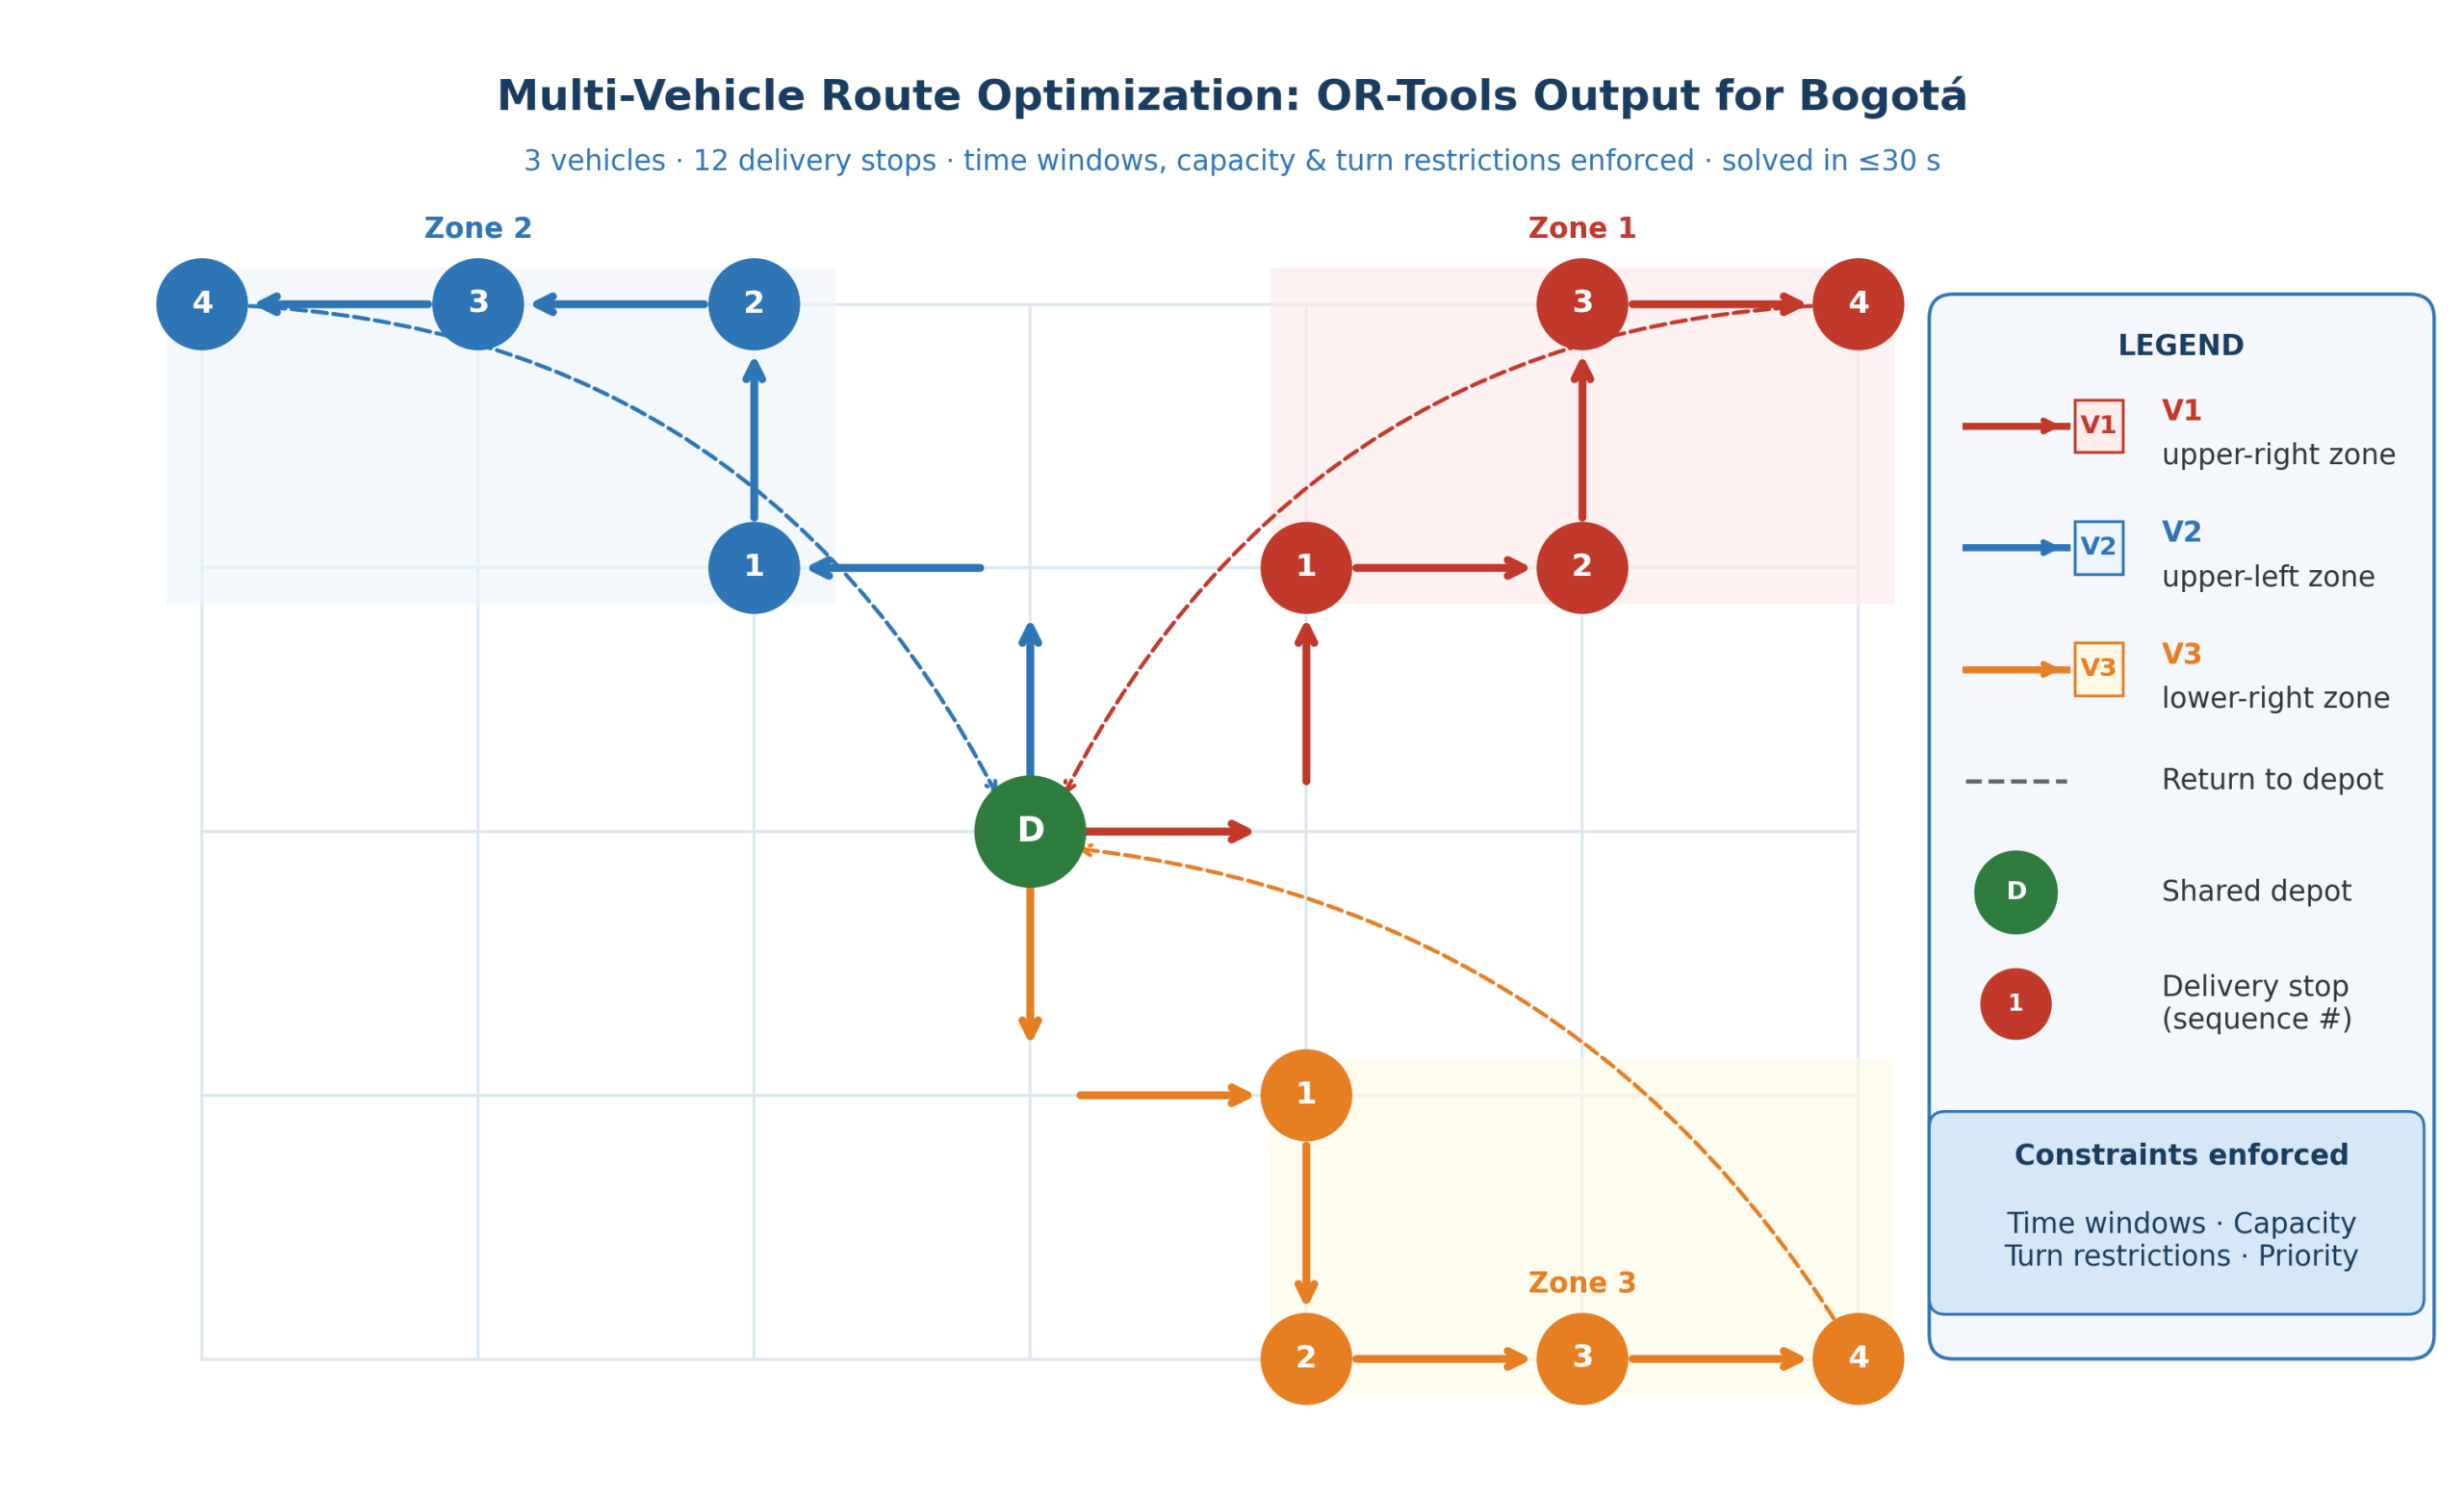
Google OR-Tools handled three VRP variants: Capacitated VRP, VRP with Time Windows, and VRP with Pickup and Delivery. Constraints were passed via JSON specifying the fleet (start and end locations, capacity, service hours) and delivery nodes (time windows, service duration, demand, priority). The solver returned optimized routes within a 30-second compute window, enforcing all six constraints in a single pass.
Step 5 — Deployment
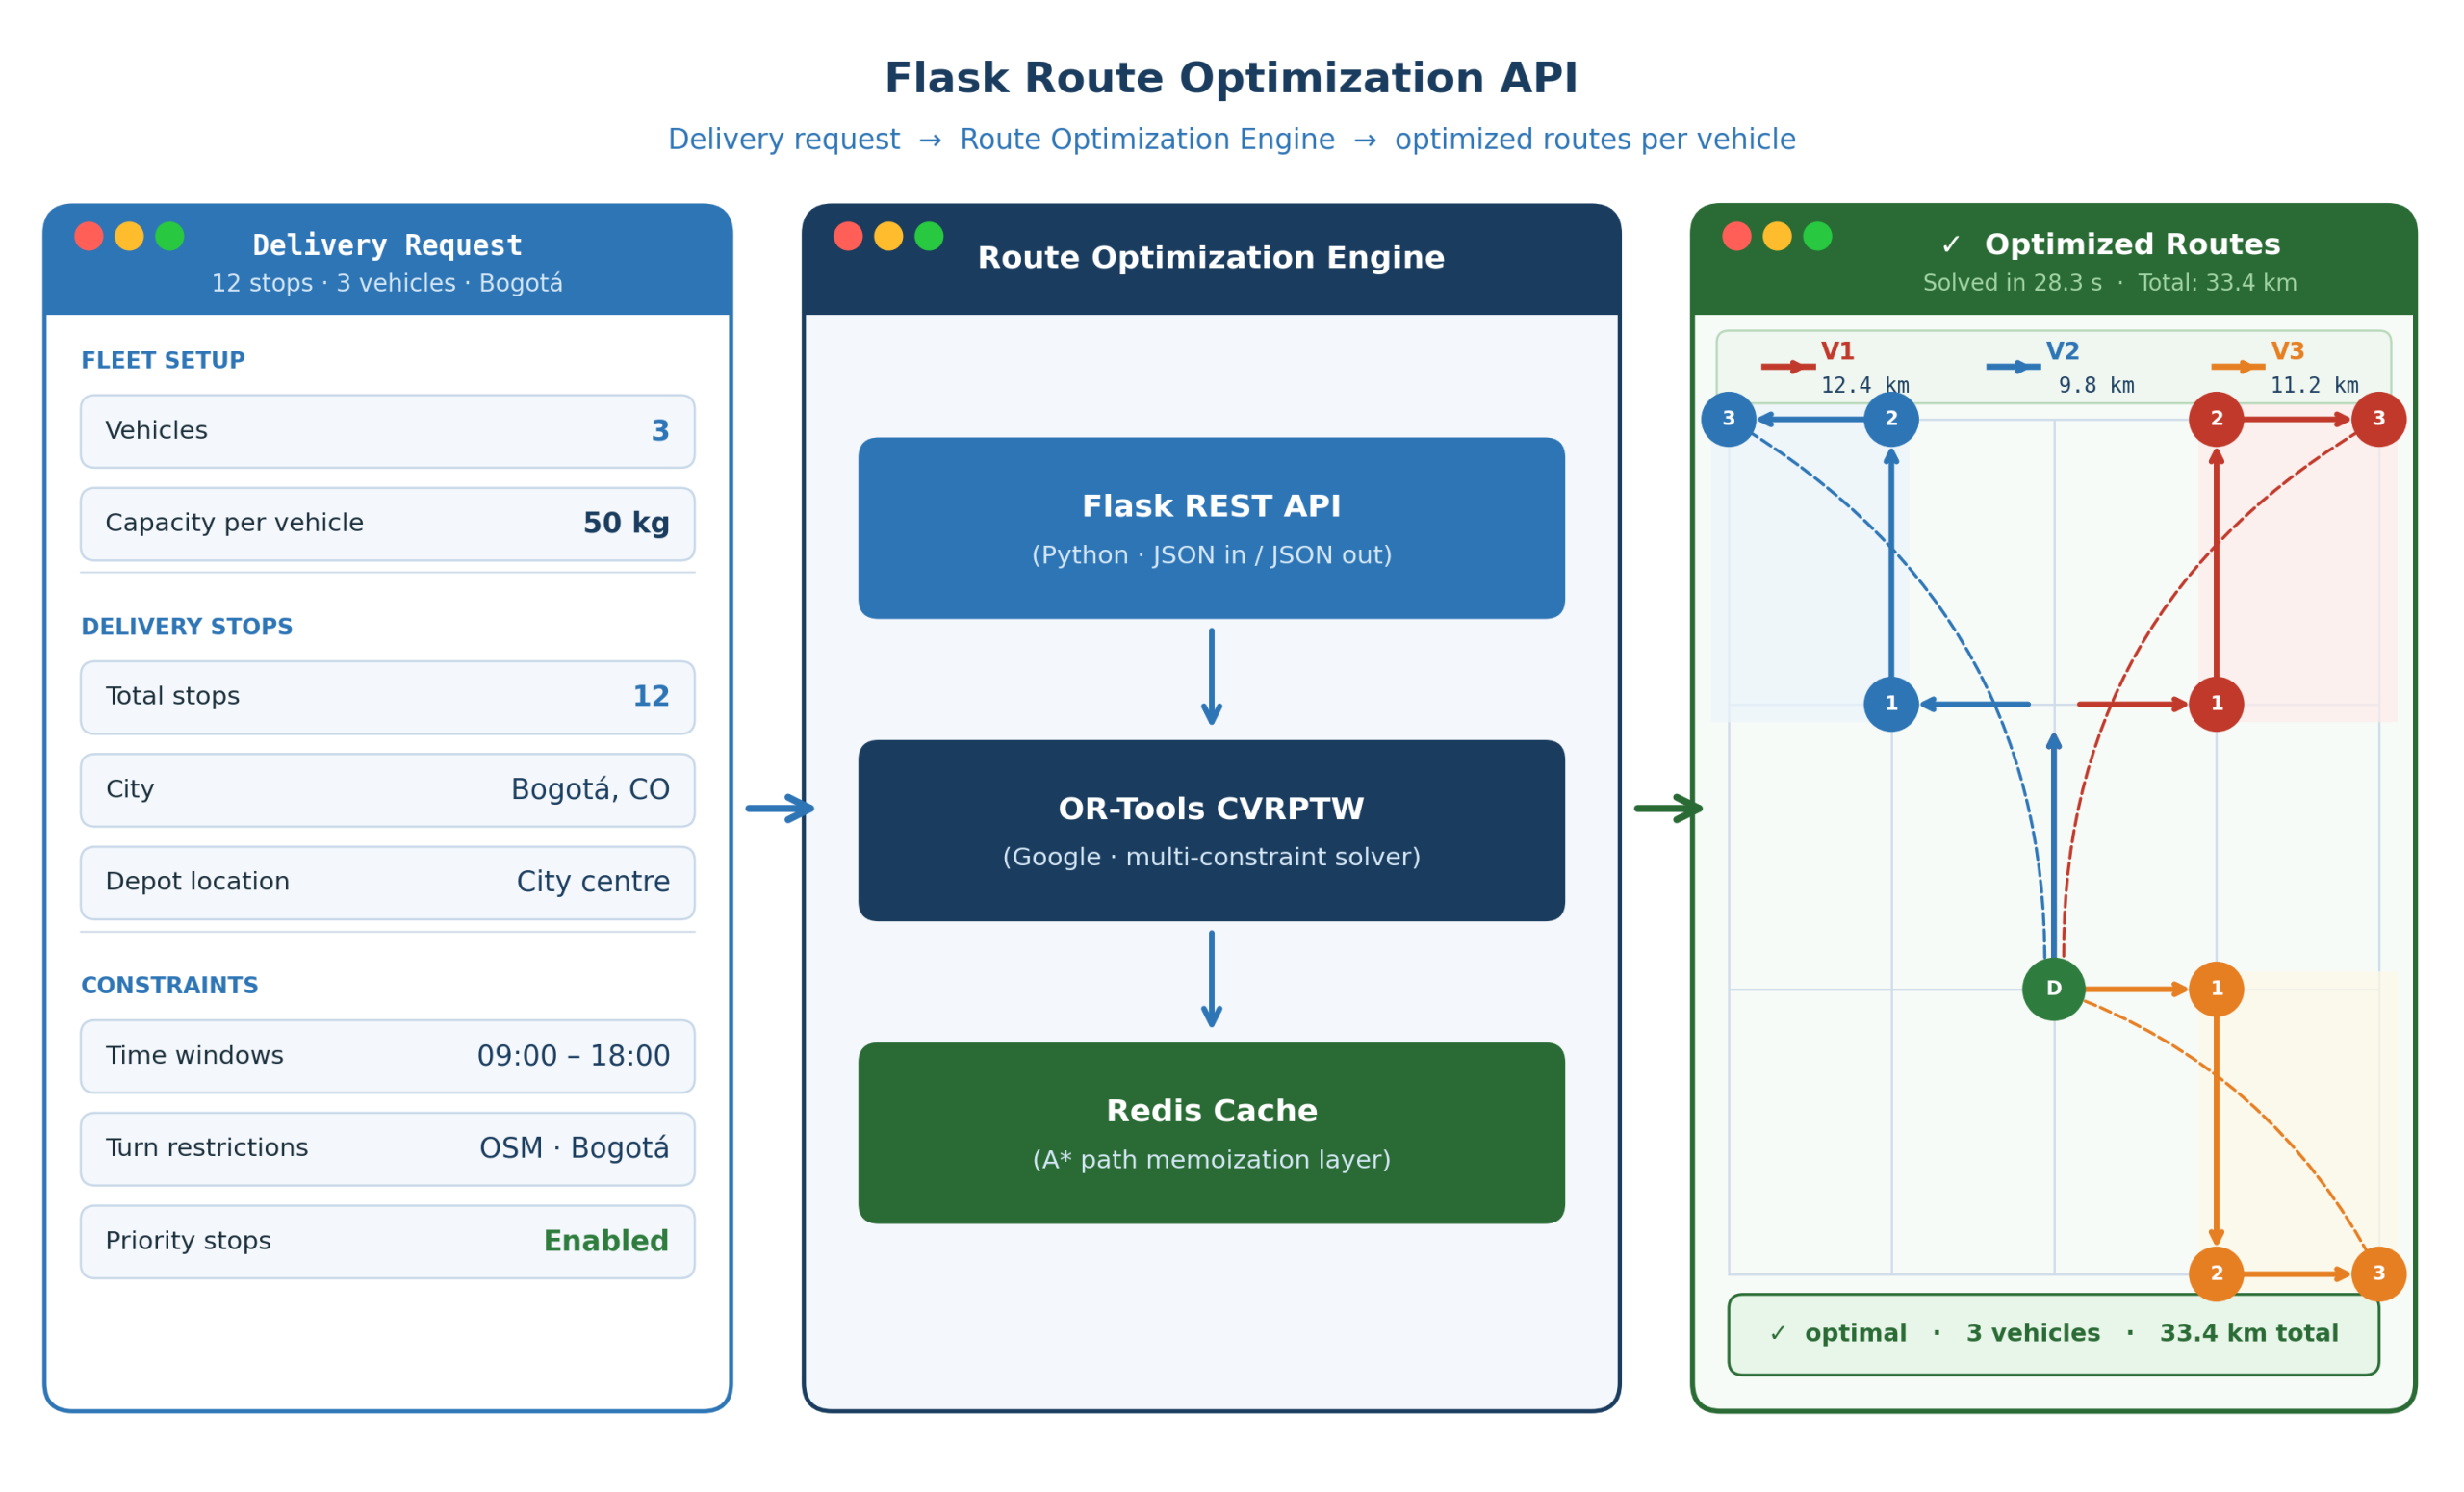
The system was packaged as a Flask REST API on AWS, using Docker containers for the full stack including Redis cache and OR-Tools solver. The API accepted and returned data in the client’s existing JSON format, making integration a drop-in replacement with no changes to the dispatch workflow.
Figure 3: OR-Tools routing output — three vehicles depart the shared depot and cover distinct delivery zones, with all six constraints enforced. Image source: Omdena.
What Was Delivered: A Production-Ready Route Optimization API
The deliverable was a Flask REST API on AWS that accepted a fleet specification and delivery node list in JSON format and returned complete optimized routes per vehicle. Dispatch planners could submit jobs without any data science expertise. the client reviewed and approved the system against complex real-world test cases, including round trips on one-way roads where pickup and dropoff fell on conflicting segments.
The route optimization API — delivery constraints submitted as JSON are solved by OR-Tools and returned as optimized per-vehicle routes. Image source: Omdena.
Impact: Measurable Outcomes Across the Client’s Operation
Post-deployment results from the client’s live operation:
10% reduction in delivery times
5% reduction in delivery costs through fewer vehicle miles traveled
20% improvement in customer satisfaction scores
Up to 15% reduction in GHG emissions per route
The turn-restriction logic also corrected a systematic routing error across Bogotá’s one-way grid, a problem affecting all dense urban networks with directional constraints. The city-agnostic architecture means the same corrections apply directly to Lima, Mexico City, and Rio de Janeiro as the client expands.
Benefits for Clients: Constraint Handling, Accessibility, and Open Infrastructure
Six-constraint optimization in one pass: capacity, time windows, service duration, pickup-delivery, vehicle endpoints, and visit priority — handled simultaneously within a 30-second compute window.
No specialist expertise required: dispatchers submit a JSON fleet and node list and receive optimized routes ready for driver assignment. No data science knowledge needed.
Open-source via OmdenaLore: the full codebase is published and auditable. Any logistics company with a compatible Shapefile and OSM dataset can adapt the framework for their city.
What Building an AI Route Optimizer for LATAM Last-Mile Logistics Taught Us
Routing to the nearest node fails on one-way grids — nearest-edge insertion is required for accurate delivery time estimation.
On Bogotá’s one-way network, the nearest drivable node to a delivery address could require several additional blocks to reach from the correct approach direction, systematically underestimating delivery time. The fix, inserting a temporary routing node on the nearest edge, corrected this and applies to any dense urban network with directional constraints.
Standard A* must track edge costs rather than node costs when OSM turn restrictions are applied.
NetworkX’s default A* marks nodes as visited after the first optimal path, blocking alternate approaches when turn restrictions are in place. Switching to edge-cost tracking resolved this with minimal code changes and restored full network traversability under all incorporated restrictions.
A working cache matters more than algorithmic perfection when latency must meet real dispatch cycles.
Hierarchical pathfinding using the road hierarchy field was identified as the correct long-term solution for worst-case A* complexity, but remained incomplete within the project timeline. Redis caching provided a practical substitute: storing computed paths for repeated source-destination pairs maintained acceptable latency across real dispatch volumes.
What’s Next: Real-Time Optimization and LATAM Expansion
The highest-priority next step is real-time route adjustment: integrating live traffic and weather data so the solver can reroute vehicles in response to changing conditions as the client scales toward one million monthly deliveries. A penalty-based handling system for infeasible constraint sets (where total demand exceeds fleet capacity) was scoped but not completed, and remains the top technical addition for the next phase.
The city-agnostic framework is ready for Lima, Mexico City, and Rio de Janeiro. Each city requires a compatible Shapefile and OSM dataset; the graph, solver, API, and cache layers are unchanged.
Key Achievements
Custom A* incorporating 92% of Bogotá’s OpenStreetMap turn restrictions
The team modified NetworkX A* to track edge costs, enabling from-via-to turn restrictions to be enforced during route search. 99% of OSM restrictions were extracted; 92% incorporated across Bogotá’s full road network.
VRP solver handling six simultaneous logistics constraints
OR-Tools supported three VRP variants (CVRP, CVRPTW, VRPPD), enforcing all six of the client’s constraints in a single optimization pass. Output was validated against complex real-world Bogotá test cases before deployment.
Production-ready Flask API on AWS, drop-in compatible with the client dispatch system
The full system (directed graph, custom router, OR-Tools solver, Redis cache) was containerized and deployed as a REST API. It accepted and returned data in the client’s existing JSON format, requiring no changes to the dispatch workflow for integration.
About the Project
Omdena partnered with a Colombian last-mile logistics provider processing 200,000+ deliveries per month, to build a route optimization system for Bogotá. Fifty AI engineers collaborated over ten weeks (January–April 2022) to develop a NetworkX-based directed road graph, a custom A* algorithm incorporating OpenStreetMap turn restrictions, and a Google OR-Tools VRP solver deployed as a Flask API on AWS.
FAQ
Why did the team use Google OR-Tools rather than a machine learning model?
ML approaches including reinforcement learning were evaluated but could not reliably enforce hard constraints like time windows and vehicle capacity across different city layouts. OR-Tools is purpose-built for VRP and handles all six constraints within a 30-second time budget — which ML approaches could not match.
How does the system handle turn restrictions on Bogotá's streets?
Turn restrictions from the OSM file were extracted as from-via-to node triples using Osmium and embedded into the modified A* implementation. The algorithm checks each candidate edge against the restriction set at every step, excluding illegal turns without removing road segments from the graph.
What are the current limitations?
The system optimizes against a static traffic snapshot with no real-time congestion adjustment. Penalty-based handling for infeasible constraint sets (where demand exceeds fleet capacity) was scoped but not yet implemented; both are top priorities for the next phase.
Can the framework apply to cities outside Bogotá?
Yes. Deploying to a new city requires only a compatible Shapefile and OSM file; the graph, router, solver, and API are unchanged. Lima, Mexico City, and Rio de Janeiro are the priority targets aligned with client expansion roadmap.
How does route optimization reduce greenhouse gas emissions?
Freight and last-mile delivery contribute significantly to urban transport emissions through unnecessary mileage. By reducing total vehicle miles traveled, the system cuts fuel consumption and associated emissions — up to 15% per route — with a compounding effect as delivery volumes scale.
Share this article
Share on LinkedIn, send by email, or copy the direct link.