ML for Good: Improving Safety in an Earthquake with Machine Learning
Machine learning for earthquake aftermath management optimization by using building coverage and street width to find the safest path for people affected.

February 4, 2020
11 minutes read

Close your eyes for a moment. Imagine a nice day like any other nice day. The Sun is shining on the sea, and birds are singing in the trees. Suddenly, the trees start to shake, and the chair you’re sitting on is also shaking. You look around and begin to notice the confusion on the faces of your colleagues transitioning to dread: an earthquake is happening.

Remembering the drills, you take refuge under the cover of your work desk as objects around you fall from their places onto the ground. You pray for your life and the lives of those you love.
Seconds feel like minutes, and minutes feel like hours.
But at last, it was over. You thank for your life, but you felt an overwhelming need to ask for more than just your own safety as a surge of anxiety takes hold of you: Are your families OK? Your mind fixates on one thing: You MUST get to them, and that takes priority over anything else.
The Problem: Reaching your family and loved ones
Well, you, the reader, are probably right in that the scenario above is a bit overly dramatic, but it is hard to overstate the level of distress natural disasters, such as an earthquake, can cause to people.
And all participants in the Istanbul Earthquake Challenge share a similar sense of urgency and seriousness in finding ways to improve the situation for the earthquake victims.
That’s why early on in the challenge, we decided to focus to apply machine learning for the aftermath of an earthquake.
Machine Learning: Earthquake prediction
The aftermath of the earthquake might see communication cut off or made extra difficult, causing problems with coordination between family members. Roads might be damaged and/or blocked up by debris falling from buildings. Traveling in the post-earthquake scenario will be chaotic and dangerous, but it won’t deter people from trying to reach their loved ones.
Machine Learning for earthquake response
It took our community of collaborators a fair bit of meandering exploration and a few fierce internal debates to finally boil the problem down to three main components: a) the representation of riskiness, b) the path-finding component, and c) the integration of a) and b).
Quantifying riskiness
This part proved to be a tricky part from the very start. Many team members devoted much time into gathering data that might contain some information regarding riskiness in the aftermath of an earthquake. We looked into various types of heatmaps: soil-composition heatmap, elevation heatmap, population heatmap, and seismic hazard map,… but we faced two problems here.
First is the problem of the sparsity of data. The resolutions of the heatmaps are both low (meaning a single value maps over a very large area) — therefore resulting in low precision, and mismatched — thus forcing us to interpolate and introduce a high level of uncertainty. Second is the problem of accurately modeling the level of risks. Not unlike trying to predict the earthquake itself, we could not find enough labeled data to comfortably make riskiness-prediction a supervised learning exercise. After a lot of persistence but fruitless efforts, we finally realized that this component of the problem needs a fresh approach that does not follow the well-trodden path of seismology.
Our breakthrough: Building coverage
A breakthrough came when a small group of members discussed the idea of using something concrete as a proxy for the abstract idea of safeness (which is the inverse of the abstract concept of riskiness). Safeness is a much more intuitive concept to a human’s mind. Safeness is also deducible from the observable surrounding: After an earthquake, it’s safer to stick to larger roads, and it’s safer to keep to areas with open-air.
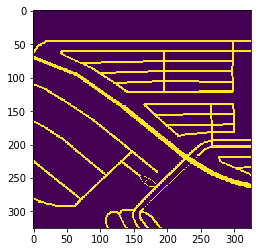
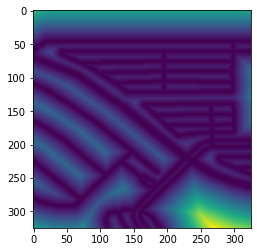
Performing Distance-Transform on street segmentation mask (above). The numeric result (below) can be used to calculate the average width of the streets.
And so, we arrived at the two proxies for safeness:
- Density of building,
- Width of road.
Areas with lower building density are safer areas, so paths that run through these areas should be less risky. Similarly, wide streets are safer streets, so paths that move along these streets are also less risky. Two task groups were quickly formed to collect satellite images of the city and extract from them street masks and building masks using two newly trained image segmentation models.
After this, distance transformation is applied to the prediction mask, giving us a rasterized map in which each pixel represents either the distance from a nearby building (in other words, how open is the space) or the distance from the side edge of the road (after some data aggregation, the road’s width).
You can read more about the segmentation models here.
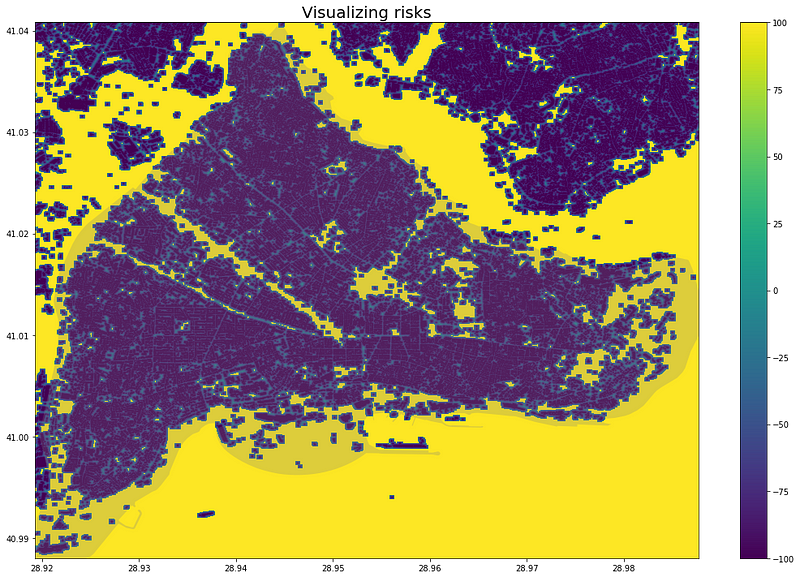
Building Density Heatmap for Fatih District. Blue-Cyan spectrum represents areas with clusters of buildings. Green-Yellow spectrum represents open areas with few buildings.
The Path-finding component
This part was a great deal more straightforward than the previous part. Path-finding is a very well-established and well-tuned area of Machine Learning.
So, very early into the challenge, multiple demos were uploaded, leveraging the existing graphs of streets and intersections made available by the Open Street Map project. The initial demos used randomly-generated dummy risk data and attempted to find paths based on a singular objective either minimizing length or minimizing risk. Q-learning, Dijkstra, and A-star were the algorithm used. Later, the Graph ML team also successfully looked into a Multi-objective path-finding algorithm based on the A-star algorithm with some tweaks that check for Pareto efficiency on every search iteration.
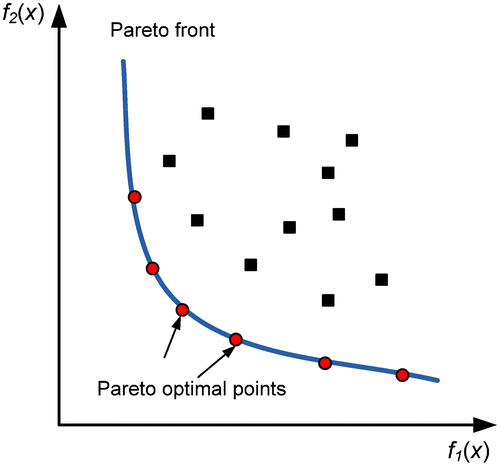
Illustration for Pareto Efficiency. Rather than optimizing for either the single objective on Y-axis or the single objective on X-axis, we look for a collection of solutions that are compromises between the two objectives.
A problem arose when testing the algorithm on large graphs made of multiple city districts: computation time increased dramatically as the number of nodes and edges ballooned.
A solution was proposed to prune nodes and edges using a hierarchical approach to path-finding. Rather than ingesting the entire city graph, a helper algorithm finds a path on a district level; the district-to-district pathings are fed to another helper algorithm that looks for the path on a neighborhood level. On the last level is the street-level graph constructed at a much-reduced size compared to the non-hierarchical approach. The smaller graph, with fewer nodes and edges, ensures that computation time remains reasonable even in the case of finding a path across the entire city.
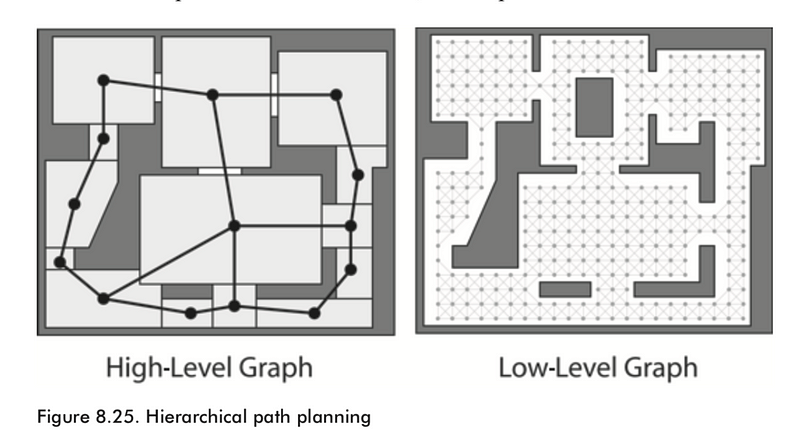
An illustration of the concept of Hierarchical Pathfinding. Compared to the low-level graph, the high-level graph is much simpler and could be calculated quickly. The result is used to construct the low-level graph ONLY in the relevant area, filtering out unnecessary parts of the low-level graph to help speed up computation time.
Integration: Machine Learning for earthquake response
A working solution needs to be more than the sum of its parts, and integration is the process of realizing that. During the final weeks of the project, we found ourselves with two components that are not obviously compatible. On the one hand, there’s the path-finding algorithm that runs on Open Street Map graphs; on the other, there’s the rasterized heatmap whose values are encoded on individual pixels. One deals with vectors and vectorized shapes that are meant to represent real-world objects regardless of scale, and the other deals with numeric values that are scale-dependent.
If you’re familiar with Graphic Design, imagine transferring selective pixel values from Photoshop outputs to an Illustrator output while maintaining the integrity of the vector file.
After many trials and errors, the team came up with a way to map both outputs onto a shared space, in the form of an algebraic matrix. Interpolations were made between vector coordinates to simulate the presence of a vector line while a Moving Average filter runs along said line to collect the values of nearby pixels. The aggregated value is then mapped to the corresponding street vector in the graph. And voila, we were able to encode the riskiness value from the heatmap to the OSM street graph.
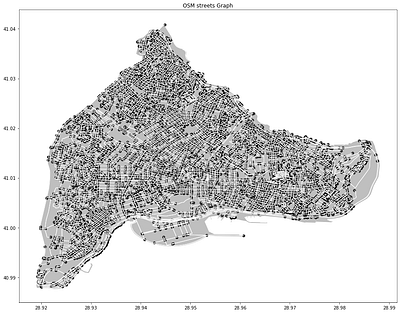

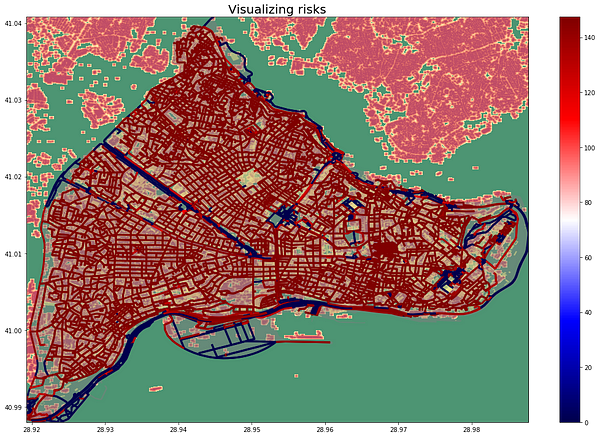
From top to bottom: the OSM graph of streets and the intersection of the area; the building density heatmap of the area; and the combined result.
The results
Thanks to the flexibility of Google Colaboratory, we were able to create a demo notebook that allows the user to test out the solution.
The demo is limited to only one district in Istanbul at the moment, namely, district Fatih. Users can test on a single-case basis with one pair of FROM-TO addresses or upload a CSV file, select the FROM column and TO column, and have the algorithm do searches in bulk.
Check out this colab notebook.
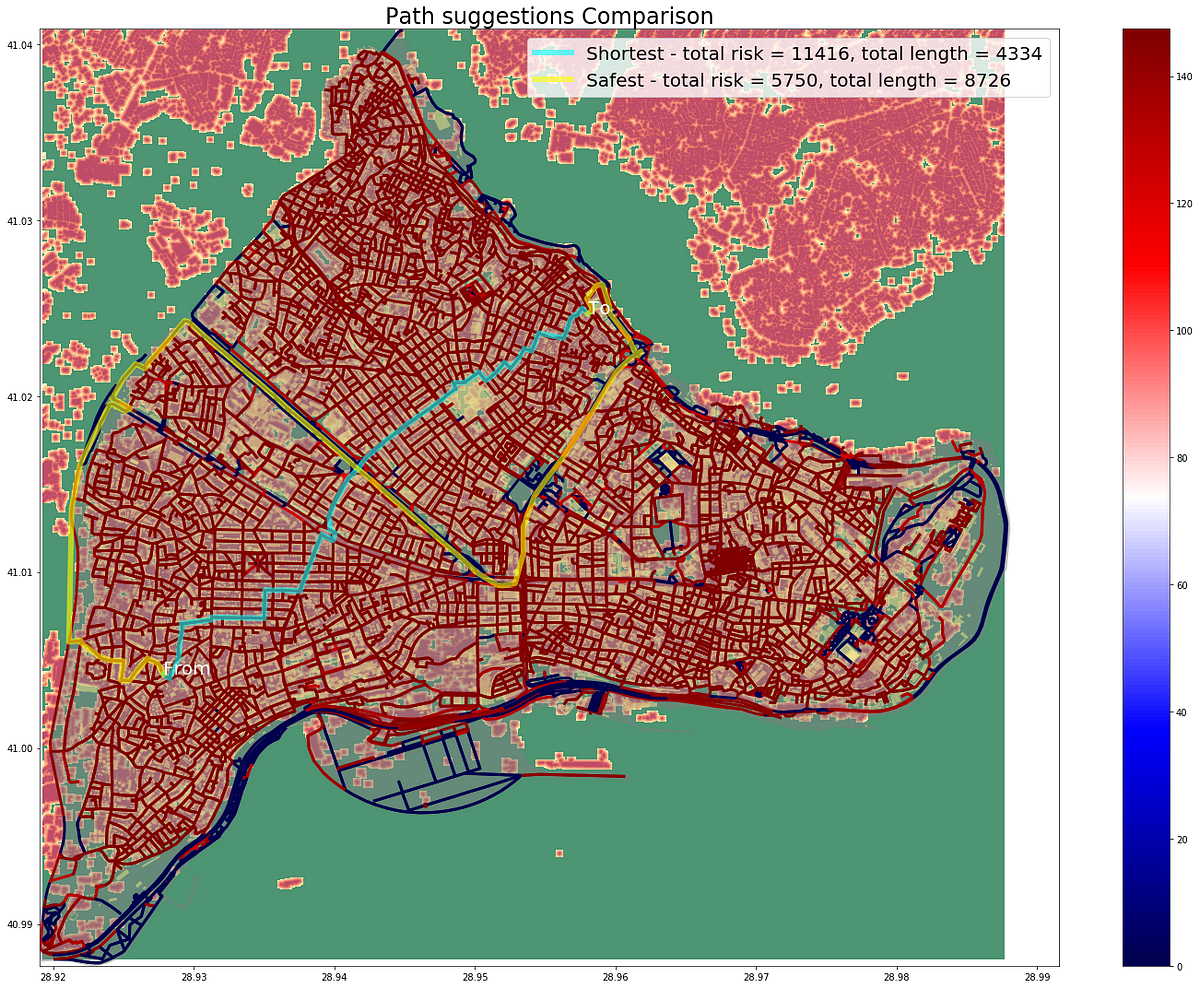
Comparison of pathfind results. In absence of the safeness data, a pathfinder will attempt to look for a path that cuts across the city, going through many areas with dense buildings and small streets. With the help of the safeness data, the algorithm can opt for paths that are longer but go through safer areas.
Conclusion
In this project, we looked into reducing the risk of traveling after the event of an earthquake using suitable machine-learning approaches. In the urban environment of Istanbul, we made the assumption that safety correlates with areas with low building density and safety correlates with wider roads and streets.
Using state-of-the-art image machine learning models, we were able to represent said assumptions in the form of rasterized heatmaps. We were also able to integrate the heatmaps with existing street graphs made available by the Open Street Map project. The final result allows the user to find the safest path from one place to another that favors going through open areas on wide streets and roads.
More importantly, all of this work was done by a team of volunteer collaborators across the world. Yet in a span of two months, we’ve explored the boundaries of the solution space, navigated through the limitations in data availability and technical complexity, and arrived at a functional solution.
I am very proud of having been a part of this challenge and, personally, thoroughly convinced that collaboration done right can bring about amazing results.
Thank you, Omdena, for this opportunity to learn and make a real impact on the world!


